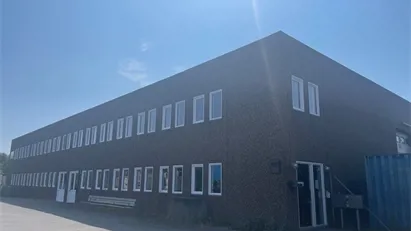
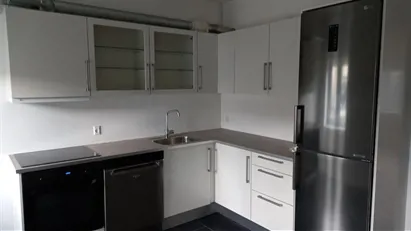
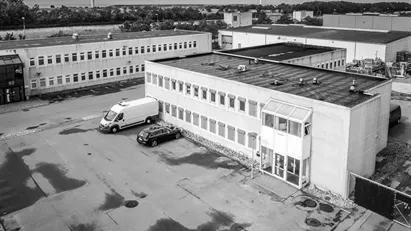
Commercial space for rent in Hvidovre
See all available commercial rentals, business rentals, business premises and commercial spaces for rent in Hvidovre below. If you are looking for commercial real estate for rent, business space, a business rental, a business premise, a commercial rental or commercial space for rent in Hvidovre, you have come to the right place. We have almost all available commercial rentals in Hvidovre in our database. Find your commercial space in Hvidovre for rent or lease here. Enjoy. More info about commercial space for rent in Hvidovre.
-
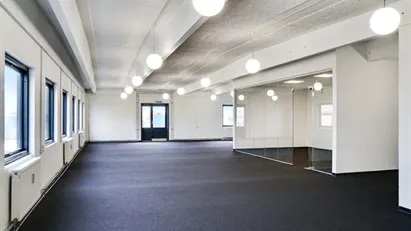
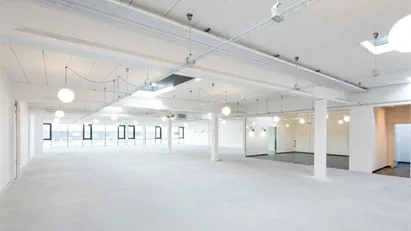
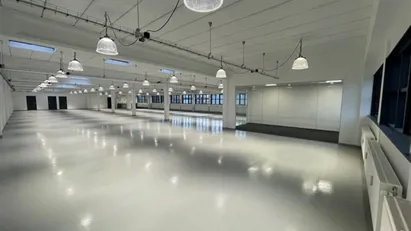
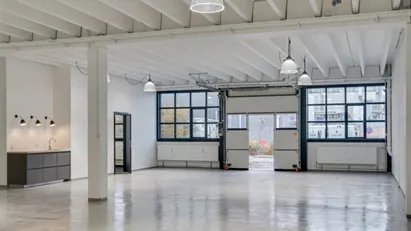
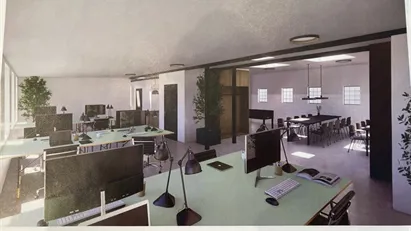
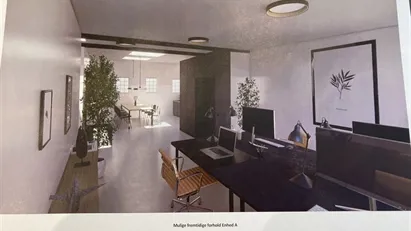
222 m2 office space for rent in Hvidovre, Greater Copenhagen, Hammerholmen
- 12,950 DKK per month
- 700 DKK /m2/year
-
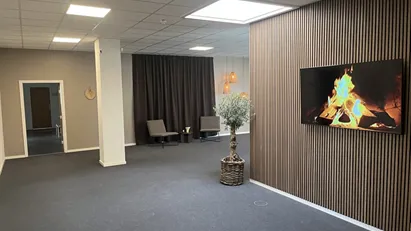
11 m2 office space for rent in Hvidovre, Greater Copenhagen, Avedøreholmen
- 1,000 DKK per month
- 1,090 DKK /m2/year
-
3122 m2 office space for rent in Hvidovre, Greater Copenhagen, Hammerholmen
- 247,159 DKK per month
- 950 DKK /m2/year
-
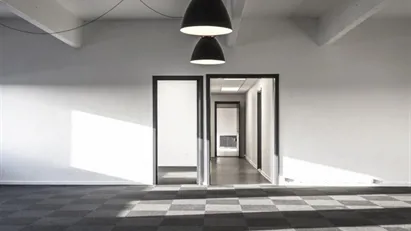
363 m2 office space for rent in Hvidovre, Greater Copenhagen, Hammerholmen
- 13,613 DKK per month
- 450 DKK /m2/year
-
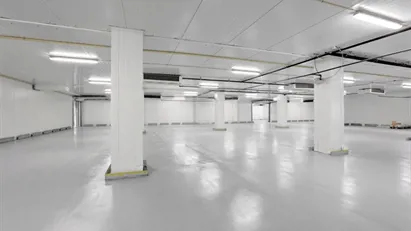
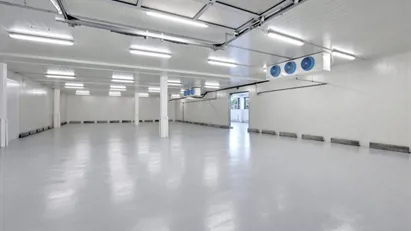
1415 m2 warehouse for rent in Hvidovre, Greater Copenhagen, Hammerholmen
- 112,021 DKK per month
- 950 DKK /m2/year
-
514 m2 office space for rent in Hvidovre, Greater Copenhagen, Sadelmagerporten
- 36,667 DKK per month
- 856 DKK /m2/year
-
611 m2 office space for rent in Hvidovre, Greater Copenhagen, Hammerholmen
- 40,733 DKK per month
- 799 DKK /m2/year
-
443 m2 warehouse for rent in Hvidovre, Greater Copenhagen, Kanalholmen
- 31,379 DKK per month
- 850 DKK /m2/year
-
893 m2 commercial space for rent in Hvidovre, Greater Copenhagen, Kanalholmen
- 55,813 DKK per month
- 750 DKK /m2/year
-
6 m2 shop for rent in Hvidovre, Greater Copenhagen, Spurvegården
- 3,917 DKK per month
- 7,833 DKK /m2/year
Frequently asked questions
Statistics on the development of available commercial real estate for rent in Hvidovre over the past month
Also see aggregate statistics on all available commercial rentals in Hvidovre over time, aggregate statistics on new commercial rentals in Hvidovre over time, aggregate statistics on rented commercial real estate in Hvidovre over time
| Date | |||
|---|---|---|---|
| 18. November 2024 | 167 | 11 | 0 |
| 17. November 2024 | 156 | 0 | 11 |
| 16. November 2024 | 167 | 0 | 3 |
| 15. November 2024 | 170 | 11 | 9 |
| 14. November 2024 | 168 | 16 | 0 |
| 13. November 2024 | 152 | 11 | 13 |
| 12. November 2024 | 154 | 3 | 1 |
| 11. November 2024 | 152 | 6 | 15 |
| 10. November 2024 | 161 | 25 | 33 |
| 9. November 2024 | 169 | 28 | 1 |
| 8. November 2024 | 142 | 1 | 2 |
| 7. November 2024 | 143 | 1 | 4 |
| 6. November 2024 | 146 | 0 | 0 |
| 5. November 2024 | 146 | 1 | 0 |
| 4. November 2024 | 145 | 0 | 1 |
| 3. November 2024 | 146 | 1 | 1 |
| 2. November 2024 | 146 | 1 | 0 |
| 1. November 2024 | 145 | 1 | 1 |
| 31. October 2024 | 145 | 7 | 0 |
| 30. October 2024 | 138 | 3 | 7 |
| 29. October 2024 | 142 | 1 | 6 |
| 28. October 2024 | 147 | 0 | 1 |
| 27. October 2024 | 148 | 0 | 2 |
| 26. October 2024 | 150 | 12 | 5 |
| 25. October 2024 | 143 | 15 | 18 |
| 24. October 2024 | 146 | 6 | 20 |
| 23. October 2024 | 160 | 6 | 5 |
| 22. October 2024 | 159 | 24 | 31 |
| 21. October 2024 | 166 | 35 | 0 |
| 20. October 2024 | 131 | 5 | 5 |
| 19. October 2024 | 131 | 2 | 0 |
Statistics on currently available commercial spaces in Hvidovre in Denmark
Also see gathered statistics of all available commercial space in Hvidovre over time, the gathered statistics of new commercial space in Hvidovre over time, the gathered statistics of rented commercial space in Hvidovre over time
| Total | |
|---|---|
| Available premises | 123 |
| New premises since yesterday | 11 |
| Rented out premises since yesterday | 0 |
| Total available m2 | 129,586 |
| Average price per m2 per year without expenses | 117 |
| Highest price per m2 per year | 1,049 |
| Lowest price per m2 per year | 60 |


