Commercial property for rent in Region of Southern Denmark
-
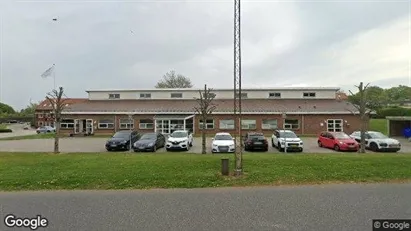
694 m2 warehouse for rent in Vejle, Vejle (region)
- 27,470 DKK per month
- 475 DKK /m2/year
-
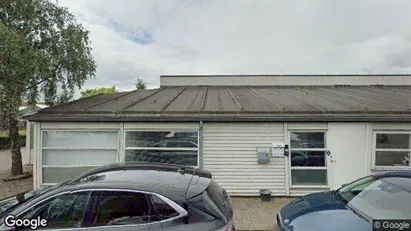
884 m2 office space for rent in Kolding, Region of Southern Denmark
- 55,065 DKK per month
- 747 DKK /m2/year
-
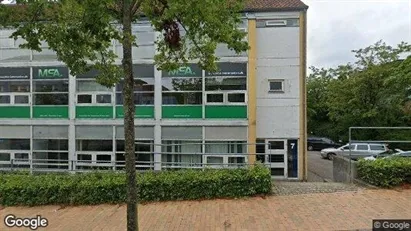
83 m2 shop for rent in Vejle, Vejle (region)
- 12,450 DKK per month
- 1,800 DKK /m2/year
-
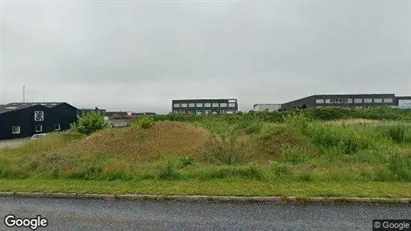
452 m2 office space for rent in Padborg, Region of Southern Denmark
- 18,190 DKK per month
- 482 DKK /m2/year
-
407 m2 warehouse for rent in Kolding, Region of Southern Denmark
- 9,971 DKK per month
- 294 DKK /m2/year
-
2361 m2 office space for rent in Kolding, Region of Southern Denmark
- 150,783 DKK per month
- 766 DKK /m2/year
-
208 m2 office space for rent in Kolding, Region of Southern Denmark
- 10,400 DKK per month
- 600 DKK /m2/year
-
334 m2 office space for rent in Kolding, Region of Southern Denmark
- 24,354 DKK per month
- 875 DKK /m2/year
-
416 m2 warehouse for rent in Vejle, Vejle (region)
- 16,709 DKK per month
- 482 DKK /m2/year
-
774 m2 warehouse for rent in Kolding, Region of Southern Denmark
- 17,479 DKK per month
- 271 DKK /m2/year
-
6532 m2 warehouse for rent in Vejle, Vejle (region)
- 268,900 DKK per month
- 494 DKK /m2/year
-
1332 m2 office space for rent in Padborg, Region of Southern Denmark
- 53,538 DKK per month
- 482 DKK /m2/year
-
25 m2 office space for rent in Vejle, Vejle (region)
- 1,208 DKK per month
- 580 DKK /m2/year
Frequently asked questions
Statistics on the development of available commercial properties for rent in Region of Southern Denmark over the past month
Below you can see the development of available commercial properties for rent in Region of Southern Denmark over the past month. In the first column you see the date. In the second column you see the total amount of commercial properties for rent in Region of Southern Denmark on the date. In the third column you see the amount of new commercial properties in Region of Southern Denmark that was available for rent on the date. In the fourth column you see the amount of commercial properties in Region of Southern Denmark that was rented on the date. Also see aggregate statistics on all available commercial properties in Region of Southern Denmark over time, aggregate statistics on new commercial properties in Region of Southern Denmark over time, aggregate statistics on rented commercial properties in Region of Southern Denmark over time
| Date | All commercial properties for rent | New commercial properties for rent | Rented out commercial properties |
|---|---|---|---|
| 24. May 2025 | 176 | 1 | 6 |
| 23. May 2025 | 181 | 3 | 0 |
| 22. May 2025 | 178 | 11 | 9 |
| 21. May 2025 | 176 | 12 | 0 |
| 20. May 2025 | 164 | 2 | 5 |
| 19. May 2025 | 167 | 0 | 1 |
| 18. May 2025 | 168 | 0 | 0 |
| 17. May 2025 | 168 | 0 | 0 |
| 16. May 2025 | 168 | 4 | 2 |
| 15. May 2025 | 166 | 0 | 3 |
| 14. May 2025 | 169 | 0 | 3 |
| 13. May 2025 | 172 | 3 | 0 |
| 12. May 2025 | 169 | 1 | 7 |
| 11. May 2025 | 175 | 5 | 0 |
| 10. May 2025 | 170 | 0 | 8 |
| 9. May 2025 | 178 | 2 | 1 |
| 8. May 2025 | 177 | 7 | 0 |
| 7. May 2025 | 170 | 1 | 0 |
| 6. May 2025 | 169 | 1 | 7 |
| 5. May 2025 | 175 | 1 | 28 |
| 4. May 2025 | 202 | 0 | 2 |
| 3. May 2025 | 204 | 1 | 18 |
| 2. May 2025 | 221 | 1 | 0 |
| 1. May 2025 | 220 | 0 | 0 |
| 30. April 2025 | 220 | 0 | 0 |
| 29. April 2025 | 220 | 0 | 3 |
| 28. April 2025 | 223 | 0 | 0 |
| 27. April 2025 | 223 | 0 | 0 |
| 26. April 2025 | 223 | 2 | 0 |
| 25. April 2025 | 221 | 20 | 0 |
| 24. April 2025 | 201 | 0 | 0 |
Statistics on currently available commercial properties for rent in Region of Southern Denmark in Denmark
In the table below, you see a series of data about available commercial properties to rent in Region of Southern Denmark.Also see gathered statistics of all available commercial properties in Region of Southern Denmark over time, the gathered statistics of new commercial properties in Region of Southern Denmark over time, the gathered statistics of rented commercial properties in Region of Southern Denmark over time
| Commercial properties | |
|---|---|
| Available premises | 178 |
| New premises since yesterday | 1 |
| Rented out premises since yesterday | 6 |
| Total available m2 | 222,296 |
| Average price per m2 per year without expenses | 114 |
| Highest price per m2 per year | 736 |
| Lowest price per m2 per year | 11 |


