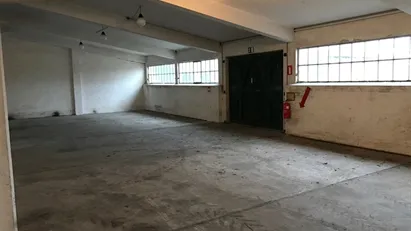
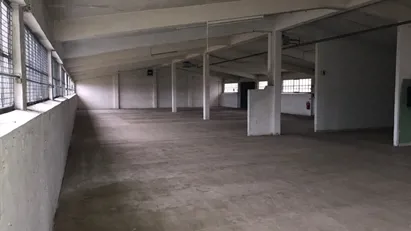
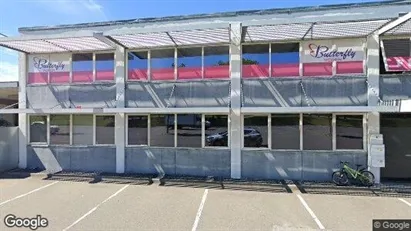
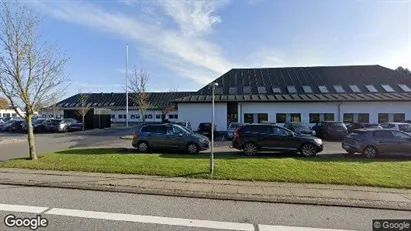
Commercial property for rent in Aalborg SV
-
18 m2 commercial space for rent in Aalborg SV, Aalborg (region)
- 1,188 DKK per month
- 791 DKK /m2/year
-
29 m2 commercial space for rent in Aalborg SV, Aalborg (region)
- 1,407 DKK per month
- 582 DKK /m2/year
-
29 m2 commercial space for rent in Aalborg SV, Aalborg (region)
- 1,369 DKK per month
- 566 DKK /m2/year
-
150 m2 shop for rent in Aalborg SV, Aalborg (region)
- 11,800 DKK per month
- 944 DKK /m2/year
-
135 m2 warehouse for rent in Aalborg SV, Aalborg (region)
- 515 DKK per month
- 45 DKK /m2/year
-
19 m2 office space for rent in Aalborg SV, Aalborg (region)
- 2,847 DKK per month
- 1,798 DKK /m2/year
-
126 m2 office space for rent in Aalborg SV, Aalborg (region)
- 6,000 DKK per month
- 571 DKK /m2/year
-
153 m2 warehouse for rent in Aalborg SV, Aalborg (region)
- 1,194 DKK per month
- 93 DKK /m2/year
-
22 m2 warehouse for rent in Aalborg SV, Aalborg (region)
- 1,224 DKK per month
- 667 DKK /m2/year
-
135 m2 warehouse for rent in Aalborg SV, Aalborg (region)
- 515 DKK per month
- 45 DKK /m2/year
-
29 m2 warehouse for rent in Aalborg SV, Aalborg (region)
- 1,255 DKK per month
- 519 DKK /m2/year
-
135 m2 warehouse for rent in Aalborg SV, Aalborg (region)
- 515 DKK per month
- 45 DKK /m2/year
-
688 m2 office space for rent in Aalborg SV, Aalborg (region)
- 41,200 DKK per month
- 718 DKK /m2/year
-
145 m2 office space for rent in Aalborg SV, Aalborg (region)
- 8,333 DKK per month
- 689 DKK /m2/year
Frequently asked questions
Statistics on the development of available commercial properties for rent in Aalborg SV over the past month
Below you can see the development of available commercial properties for rent in Aalborg SV over the past month. In the first column you see the date. In the second column you see the total amount of commercial properties for rent in Aalborg SV on the date. In the third column you see the amount of new commercial properties in Aalborg SV that was available for rent on the date. In the fourth column you see the amount of commercial properties in Aalborg SV that was rented on the date. Also see aggregate statistics on all available commercial properties in Aalborg SV over time, aggregate statistics on new commercial properties in Aalborg SV over time, aggregate statistics on rented commercial properties in Aalborg SV over time
Date | All commercial properties for rent | New commercial properties for rent | Rented out commercial properties |
---|---|---|---|
23. January 2025 | 3 | 0 | 0 |
22. January 2025 | 3 | 0 | 0 |
21. January 2025 | 3 | 0 | 0 |
20. January 2025 | 3 | 0 | 0 |
19. January 2025 | 3 | 0 | 0 |
18. January 2025 | 3 | 0 | 0 |
17. January 2025 | 3 | 0 | 0 |
16. January 2025 | 3 | 0 | 0 |
15. January 2025 | 3 | 0 | 0 |
14. January 2025 | 3 | 0 | 0 |
13. January 2025 | 3 | 0 | 0 |
12. January 2025 | 3 | 0 | 0 |
11. January 2025 | 3 | 0 | 0 |
10. January 2025 | 3 | 0 | 0 |
9. January 2025 | 3 | 0 | 0 |
8. January 2025 | 3 | 0 | 0 |
7. January 2025 | 3 | 0 | 0 |
6. January 2025 | 3 | 0 | 0 |
5. January 2025 | 3 | 0 | 0 |
4. January 2025 | 3 | 0 | 0 |
3. January 2025 | 3 | 0 | 1 |
2. January 2025 | 4 | 0 | 0 |
1. January 2025 | 4 | 0 | 0 |
31. December 2024 | 4 | 0 | 0 |
30. December 2024 | 4 | 0 | 0 |
29. December 2024 | 4 | 0 | 0 |
28. December 2024 | 4 | 0 | 0 |
27. December 2024 | 4 | 0 | 0 |
26. December 2024 | 4 | 0 | 0 |
25. December 2024 | 4 | 0 | 0 |
24. December 2024 | 4 | 0 | 0 |
Statistics on currently available commercial properties for rent in Aalborg SV in Denmark
In the table below, you see a series of data about available commercial properties to rent in Aalborg SV.Also see gathered statistics of all available commercial properties in Aalborg SV over time, the gathered statistics of new commercial properties in Aalborg SV over time, the gathered statistics of rented commercial properties in Aalborg SV over time
Commercial properties | |
---|---|
Available premises | 3 |
New premises since yesterday | 0 |
Rented out premises since yesterday | 0 |
Total available m2 | 76 |
Average price per m2 per year without expenses | 86 |
Highest price per m2 per year | 106 |
Lowest price per m2 per year | 76 |