Industrial property in Gandrup
See available industrial units, workshop spaces, workshops for rent and industrial properties for rent in Gandrup below. If you are looking for workshop space, industrial space, industrial unit, workshop for rent or industrial property for rent in Gandrup, you have come to the right place. We have almost all available industrial properties in Gandrup for rent or lease in our database. Find your industrial property in Gandrup here. Enjoy. More info about workshop and industrial property for rent in Gandrup.
-
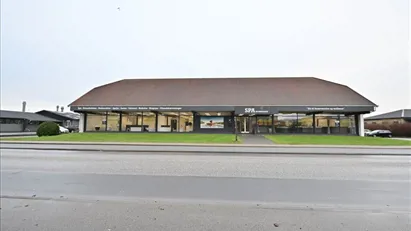
150 m2 shop for rent in Aalborg SV, Aalborg (region), Nibevej
- 11,800 DKK per month
- 944 DKK /m2/year
-
150 m2 shop for rent in Hadsund, North Jutland Region, Storegade
- 5,000 DKK per month
- 400 DKK /m2/year
-
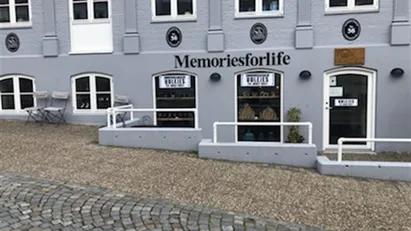
65 m2 shop for rent in Aalborg, Aalborg (region), Nørregade
- 9,500 DKK per month
- 1,753 DKK /m2/year
-
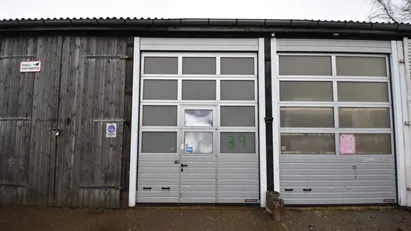
30 m2 industrial property for rent in Aalborg, Aalborg (region), Hjulmagervej
- 2,400 DKK per month
- 960 DKK /m2/year
-
188 m2 clinic for rent in Aalborg, Aalborg (region), Østerågade
- 15,000 DKK per month
- 957 DKK /m2/year
-
115 m2 restaurant for rent in Nørresundby, North Jutland Region, Thistedvej
- 6,900 DKK per month
- 720 DKK /m2/year
-
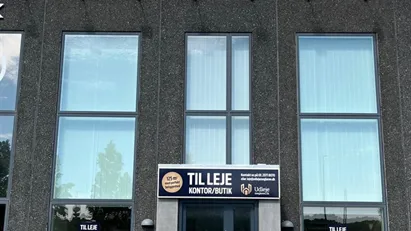
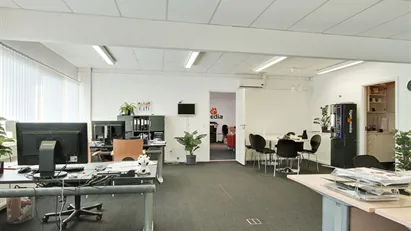
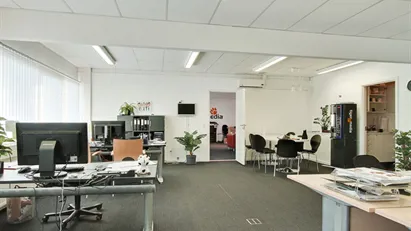
56 m2 office space for rent in Aalborg, Aalborg (region), Nørregade
- 4,975 DKK per month
- 1,066 DKK /m2/year
-
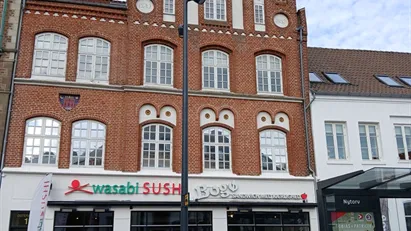
76 m2 shop for rent in Aalborg, Aalborg (region), Gravensgade
- 8,750 DKK per month
- 1,381 DKK /m2/year
-
260 m2 office space for rent in Aalborg, Aalborg (region), Sankt Hans Gade
- 20,000 DKK per month
- 923 DKK /m2/year
-
250 m2 restaurant for rent in Nykøbing Mors, North Jutland Region, Vej ikke angivet
Free contact- 8,000 DKK per month
- 384 DKK /m2/year
-
25 m2 warehouse for rent in Aalborg, Aalborg (region), Sankelmarksgade
- 500 DKK per month
- 240 DKK /m2/year
Frequently asked questions
Statistics on the development of available industrial properties for rent in Gandrup over the past month
Below you can see the development of available industrial properties for rent in Gandrup over the past month. In the first column you see the date. In the second column you see the total amount of industrial properties for rent in Gandrup on the date. In the third column you see the amount of new industrial properties in Gandrup that was available for rent on the date. In the fourth column you see the amount of industrial properties in Gandrup that was rented on the date. Also see aggregate statistics on all available industrial properties in Gandrup over time, aggregate statistics on new industrial properties in Gandrup over time, aggregate statistics on rented industrial properties in Gandrup over time
| Date | All industrial properties for rent | New industrial properties for rent | Rented out industrial properties |
|---|---|---|---|
| 19. December 2024 | 0 | 0 | 0 |
| 18. December 2024 | 0 | 0 | 0 |
| 17. December 2024 | 0 | 0 | 0 |
| 16. December 2024 | 0 | 0 | 0 |
| 15. December 2024 | 0 | 0 | 0 |
| 14. December 2024 | 0 | 0 | 0 |
| 13. December 2024 | 0 | 0 | 0 |
| 12. December 2024 | 0 | 0 | 0 |
| 11. December 2024 | 0 | 0 | 0 |
| 10. December 2024 | 0 | 0 | 0 |
| 9. December 2024 | 0 | 0 | 0 |
| 8. December 2024 | 0 | 0 | 0 |
| 7. December 2024 | 0 | 0 | 0 |
| 6. December 2024 | 0 | 0 | 0 |
| 5. December 2024 | 0 | 0 | 0 |
| 4. December 2024 | 0 | 0 | 0 |
| 3. December 2024 | 0 | 0 | 0 |
| 2. December 2024 | 0 | 0 | 0 |
| 1. December 2024 | 0 | 0 | 0 |
| 30. November 2024 | 0 | 0 | 0 |
| 29. November 2024 | 0 | 0 | 0 |
| 28. November 2024 | 0 | 0 | 0 |
| 27. November 2024 | 0 | 0 | 0 |
| 26. November 2024 | 0 | 0 | 0 |
| 25. November 2024 | 0 | 0 | 0 |
| 24. November 2024 | 0 | 0 | 0 |
| 23. November 2024 | 0 | 0 | 0 |
| 22. November 2024 | 0 | 0 | 0 |
| 21. November 2024 | 0 | 0 | 0 |
| 20. November 2024 | 0 | 0 | 0 |
| 19. November 2024 | 0 | 0 | 0 |
Statistics on currently available industrial properties for rent in Gandrup in Denmark
In the table below, you see a series of data about available industrial properties to rent in Gandrup.Also see gathered statistics of all available industrial properties in Gandrup over time, the gathered statistics of new industrial properties in Gandrup over time, the gathered statistics of rented industrial properties in Gandrup over time
| Industrial properties | |
|---|---|
| Available premises | 0 |
| New premises since yesterday | 0 |
| Rented out premises since yesterday | 0 |
| Total available m2 | 0 |
| Average price per m2 per year without expenses | 0 |
| Highest price per m2 per year | 0 |
| Lowest price per m2 per year | 0 |


