Industrial property for rent, Kristianstad, Skåne County, Tegskiftesvägen - ÖNNESTAD 8
Tegskiftesvägen - ÖNNESTAD 8, Kristianstad- Industrial property for rent
- 150 - 300 m2

- Industrial property for rent
- 150 - 300 m2
Industrial property for rent, Kristianstad, Skåne County, Tegskiftesvägen - ÖNNESTAD 8
Anpassa lokalen efter ert behov
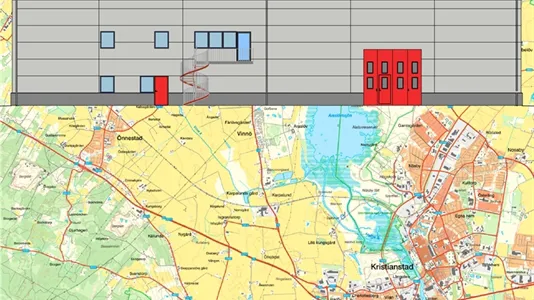
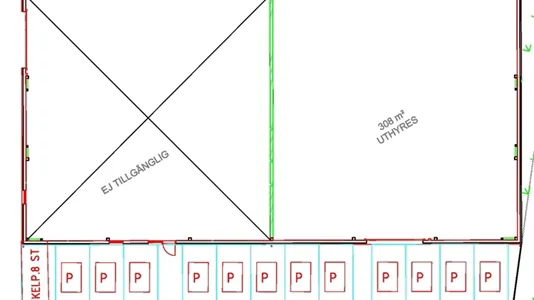
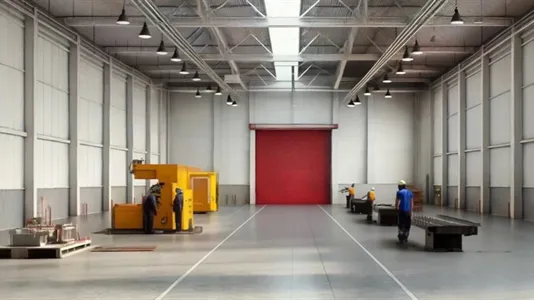
Vi erbjuder en nybyggnation på 300 m², designad lokal i nära samarbete med dig som hyresgäst för att möta just dina behov.
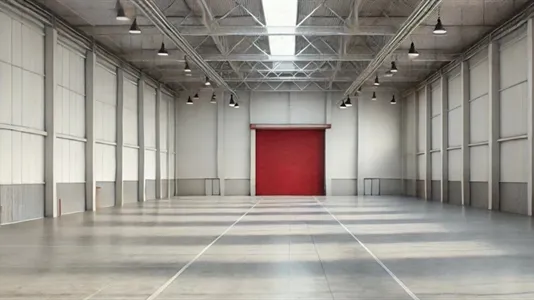
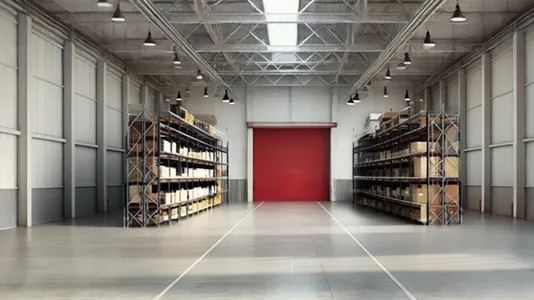
Perfekt för allt från lager till industriell verksamhet.
Natursköna Bockeboda strövområde ligger i närheten.
Gångavstånd till Ica och andra lokala tjänster.
Grannar inkluderar välrenommerade företag som Skanska Sverige AB, Swerock AB, Saferoad Smekab AB och Dennis Bygg i Önnestad AB.
Fördelar med detta läge:
Synergimöjligheter med andra lokala verksamheter.
Möjlighet till långsiktigt samarbete för att skapa bästa förutsättningar för din verksamhet.
Information and data
This industrial property for rent, that can also be used as Warehouse or Shop, is located on Tegskiftesvägen - ÖNNESTAD in Kristianstad. Kristianstad is located in Skåne County. The company space is 300 m2 in total.
Similar search results
-
66 m2 warehouse for rent in Kristianstad, Skåne County, Koriandervägen
- 3,900 SEK per month
- 709 SEK /m2/year
-
7 m2 warehouse for rent in Kristianstad, Skåne County, Rörvägen
- 764 SEK per month
- 1,309 SEK /m2/year
Frequently asked questions
Statistics on the development of available industrial properties for rent in Kristianstad over the past month
Below you can see the development of available industrial properties for rent in Kristianstad over the past month. In the first column you see the date. In the second column you see the total amount of industrial properties for rent in Kristianstad on the date. In the third column you see the amount of new industrial properties in Kristianstad that was available for rent on the date. In the fourth column you see the amount of industrial properties in Kristianstad that was rented on the date. Also see aggregate statistics on all available industrial properties in Kristianstad over time, aggregate statistics on new industrial properties in Kristianstad over time, aggregate statistics on rented industrial properties in Kristianstad over time
| Date | All industrial properties for rent | New industrial properties for rent | Rented out industrial properties |
|---|---|---|---|
| 28. December 2024 | 12 | 0 | 0 |
| 27. December 2024 | 12 | 0 | 0 |
| 26. December 2024 | 12 | 0 | 0 |
| 25. December 2024 | 12 | 0 | 0 |
| 24. December 2024 | 12 | 0 | 0 |
| 23. December 2024 | 12 | 0 | 0 |
| 22. December 2024 | 12 | 0 | 0 |
| 21. December 2024 | 12 | 0 | 0 |
| 20. December 2024 | 12 | 0 | 0 |
| 19. December 2024 | 12 | 0 | 0 |
| 18. December 2024 | 12 | 0 | 0 |
| 17. December 2024 | 12 | 0 | 0 |
| 16. December 2024 | 12 | 0 | 0 |
| 15. December 2024 | 12 | 0 | 0 |
| 14. December 2024 | 12 | 0 | 0 |
| 13. December 2024 | 12 | 0 | 0 |
| 12. December 2024 | 12 | 0 | 1 |
| 11. December 2024 | 13 | 0 | 1 |
| 10. December 2024 | 14 | 0 | 0 |
| 9. December 2024 | 14 | 0 | 0 |
| 8. December 2024 | 14 | 0 | 0 |
| 7. December 2024 | 14 | 0 | 0 |
| 6. December 2024 | 14 | 0 | 0 |
| 5. December 2024 | 14 | 0 | 0 |
| 4. December 2024 | 14 | 0 | 0 |
| 3. December 2024 | 14 | 0 | 0 |
| 2. December 2024 | 14 | 0 | 0 |
| 1. December 2024 | 14 | 0 | 0 |
| 30. November 2024 | 14 | 0 | 0 |
| 29. November 2024 | 14 | 1 | 1 |
| 28. November 2024 | 14 | 2 | 0 |
Statistics on currently available industrial properties for rent in Kristianstad
In the table below, you see a series of data about available industrial properties to rent in Kristianstad.Also see gathered statistics of all available industrial properties in Kristianstad over time, the gathered statistics of new industrial properties in Kristianstad over time, the gathered statistics of rented industrial properties in Kristianstad over time
| Industrial properties | |
|---|---|
| Available premises | 12 |
| New premises since yesterday | 0 |
| Rented out premises since yesterday | 0 |
| Total available m2 | 24,640 |
| Average price per m2 per year without expenses | 52 |
| Highest price per m2 per year | 52 |
| Lowest price per m2 per year | 52 |


