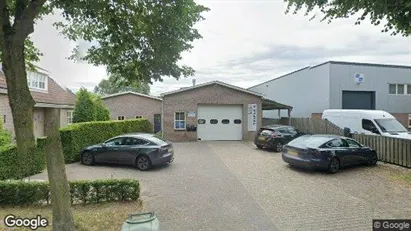
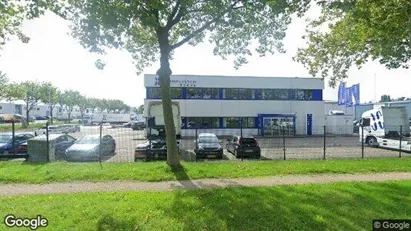
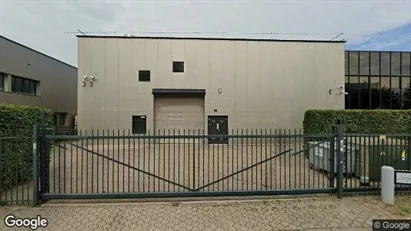
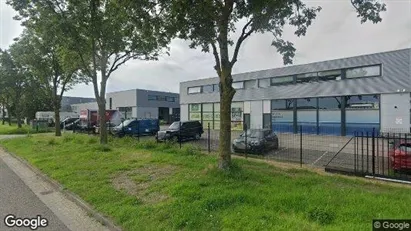
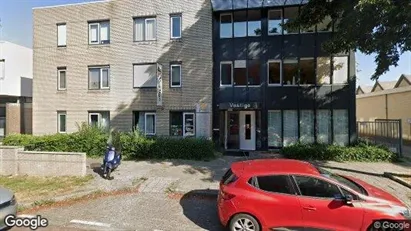
Industrial property for rent in Lingewaal
See industrial units for rent, workshop spaces for rent, workshops for rent and industrial properties for rent in Lingewaal below. If you are looking for workshop space for rent, industrial space for rent, industrial unit for rent, workshop for rent or industrial property for rent in Lingewaal, you have come to the right place. We have almost all available industrial properties for rent or leasein Lingewaal in our database. Find your industrial property or workshop for rent in Lingewaal here. Enjoy.
-
300 m2 commercial space for rent in Wijchen, Gelderland
- 1,500 EUR per month
- 60 EUR /m2/year
-
30 m2 office space for rent in Zevenaar, Gelderland
- 595 EUR per month
- 238 EUR /m2/year
-
200 m2 office space for rent in Zutphen, Gelderland
- 1,995 EUR per month
- 119.70 EUR /m2/year
-
20 m2 office space for rent in Arnhem, Gelderland
- 1,673 EUR per month
- 1,003.80 EUR /m2/year
-
20 m2 office space for rent in Arnhem, Gelderland
- 1,673 EUR per month
- 1,003.80 EUR /m2/year
-
130 m2 commercial space for rent in Harderwijk, Gelderland
- 1,150 EUR per month
- 106.15 EUR /m2/year
-
110 m2 office space for rent in Apeldoorn, Gelderland
- 1,798 EUR per month
- 196.15 EUR /m2/year
-
2580 m2 commercial space for rent in Tiel, Gelderland
- 17,225 EUR per month
- 80.12 EUR /m2/year
-
30 m2 office space for rent in Tiel, Gelderland
- 539 EUR per month
- 215.60 EUR /m2/year
-
876 m2 commercial space for rent in Nijmegen, Gelderland
- 3,958 EUR per month
- 54.22 EUR /m2/year
-
10 m2 office space for rent in Apeldoorn, Gelderland
- 319 EUR per month
- 382.80 EUR /m2/year
-
54 m2 commercial space for rent in Overbetuwe, Gelderland
- 607 EUR per month
- 134.89 EUR /m2/year
-
10 m2 office space for rent in Apeldoorn, Gelderland
- 79 EUR per month
- 94.80 EUR /m2/year
-
75 m2 office space for rent in Tiel, Gelderland
- 1,229 EUR per month
- 196.64 EUR /m2/year
-
30 m2 office space for rent in Apeldoorn, Gelderland
- 439 EUR per month
- 175.60 EUR /m2/year
-
10 m2 office space for rent in Tiel, Gelderland
- 79 EUR per month
- 94.80 EUR /m2/year
Frequently asked questions
Statistics on the development of available industrial properties for rent in Lingewaal over the past month
Below you can see the development of available industrial properties for rent in Lingewaal over the past month. In the first column you see the date. In the second column you see the total amount of industrial properties for rent in Lingewaal on the date. In the third column you see the amount of new industrial properties in Lingewaal that was available for rent on the date. In the fourth column you see the amount of industrial properties in Lingewaal that was rented on the date. Also see aggregate statistics on all available industrial properties in Lingewaal over time, aggregate statistics on new industrial properties in Lingewaal over time, aggregate statistics on rented industrial properties in Lingewaal over time
Date | All industrial properties for rent | New industrial properties for rent | Rented out industrial properties |
---|---|---|---|
23. April 2025 | 0 | 0 | 0 |
22. April 2025 | 0 | 0 | 0 |
21. April 2025 | 0 | 0 | 0 |
20. April 2025 | 0 | 0 | 0 |
19. April 2025 | 0 | 0 | 0 |
18. April 2025 | 0 | 0 | 0 |
17. April 2025 | 0 | 0 | 0 |
16. April 2025 | 0 | 0 | 0 |
15. April 2025 | 0 | 0 | 0 |
14. April 2025 | 0 | 0 | 0 |
13. April 2025 | 0 | 0 | 0 |
12. April 2025 | 0 | 0 | 0 |
11. April 2025 | 0 | 0 | 0 |
10. April 2025 | 0 | 0 | 0 |
9. April 2025 | 0 | 0 | 0 |
8. April 2025 | 0 | 0 | 0 |
7. April 2025 | 0 | 0 | 0 |
6. April 2025 | 0 | 0 | 0 |
5. April 2025 | 0 | 0 | 0 |
4. April 2025 | 0 | 0 | 0 |
3. April 2025 | 0 | 0 | 0 |
2. April 2025 | 0 | 0 | 0 |
1. April 2025 | 0 | 0 | 0 |
31. March 2025 | 0 | 0 | 0 |
30. March 2025 | 0 | 0 | 0 |
29. March 2025 | 0 | 0 | 0 |
28. March 2025 | 0 | 0 | 0 |
27. March 2025 | 0 | 0 | 0 |
26. March 2025 | 0 | 0 | 0 |
25. March 2025 | 0 | 0 | 0 |
24. March 2025 | 0 | 0 | 0 |
Statistics on currently available industrial properties for rent in Lingewaal in The Netherlands
In the table below, you see a series of data about available industrial properties to rent in Lingewaal.Also see gathered statistics of all available industrial properties in Lingewaal over time, the gathered statistics of new industrial properties in Lingewaal over time, the gathered statistics of rented industrial properties in Lingewaal over time
Industrial properties | |
---|---|
Available premises | 0 |
New premises since yesterday | 0 |
Rented out premises since yesterday | 0 |
Total available m2 | 0 |
Average price per m2 per year without expenses | 0 |
Highest price per m2 per year | 0 |
Lowest price per m2 per year | 0 |