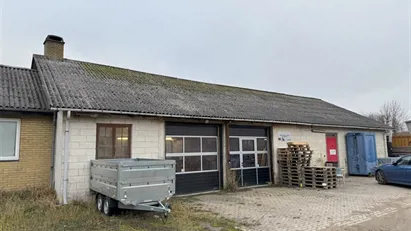
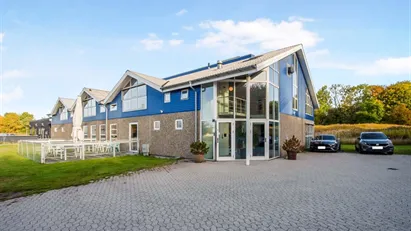
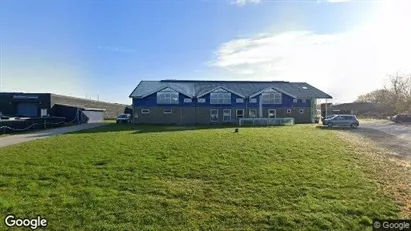
Industrial property for rent, Lynge, North Zealand, Nøglegårdsvej 8
Nøglegårdsvej 8, 3540 Lynge- Industrial property for rent
- 500 m2
- 25,000 DKK per month

- Industrial property for rent
- 500 m2
- 25,000 DKK per month
Industrial property for rent, Lynge, North Zealand, Nøglegårdsvej 8
Produktion/lager/kontor
God stand.
Fin placering logistisk og til offentlig transport.
Information and data
This industrial property for rent, is located in Lynge. Lynge is located in North Zealand. The company space is 500 m2 in total. You can rent this industrial property for 300,000 DKK per year.
Similar search results
-
77 m2 shop for rent in Lynge, North Zealand
- 15,519 DKK per month
- 2,418 DKK /m2/year
-
7 m2 office space for rent in Lynge, North Zealand
- 4,500 DKK per month
- 7,714 DKK /m2/year
-
218 m2 office space for rent in Lynge, North Zealand
- 15,078 DKK per month
- 830 DKK /m2/year
-
475 m2 office space for rent in Lynge, North Zealand
- 27,760 DKK per month
- 701 DKK /m2/year
-
950 m2 office space for rent in Lynge, North Zealand
- 58,438 DKK per month
- 738 DKK /m2/year
-
125 m2 warehouse for rent in Lynge, North Zealand
- 8,000 DKK per month
- 768 DKK /m2/year
Frequently asked questions
Statistics on the development of available industrial properties for rent in Lynge over the past month
Below you can see the development of available industrial properties for rent in Lynge over the past month. In the first column you see the date. In the second column you see the total amount of industrial properties for rent in Lynge on the date. In the third column you see the amount of new industrial properties in Lynge that was available for rent on the date. In the fourth column you see the amount of industrial properties in Lynge that was rented on the date. Also see aggregate statistics on all available industrial properties in Lynge over time, aggregate statistics on new industrial properties in Lynge over time, aggregate statistics on rented industrial properties in Lynge over time
| Date | All industrial properties for rent | New industrial properties for rent | Rented out industrial properties |
|---|---|---|---|
| 25. January 2025 | 5 | 0 | 0 |
| 24. January 2025 | 5 | 0 | 0 |
| 23. January 2025 | 5 | 0 | 0 |
| 22. January 2025 | 5 | 0 | 0 |
| 21. January 2025 | 5 | 0 | 0 |
| 20. January 2025 | 5 | 0 | 0 |
| 19. January 2025 | 5 | 0 | 0 |
| 18. January 2025 | 5 | 0 | 0 |
| 17. January 2025 | 5 | 0 | 0 |
| 16. January 2025 | 5 | 0 | 0 |
| 15. January 2025 | 5 | 0 | 0 |
| 14. January 2025 | 5 | 0 | 0 |
| 13. January 2025 | 5 | 0 | 0 |
| 12. January 2025 | 5 | 0 | 0 |
| 11. January 2025 | 5 | 0 | 0 |
| 10. January 2025 | 5 | 0 | 0 |
| 9. January 2025 | 5 | 0 | 0 |
| 8. January 2025 | 5 | 2 | 0 |
| 7. January 2025 | 3 | 0 | 0 |
| 6. January 2025 | 3 | 0 | 0 |
| 5. January 2025 | 3 | 0 | 0 |
| 4. January 2025 | 3 | 0 | 0 |
| 3. January 2025 | 3 | 0 | 0 |
| 2. January 2025 | 3 | 0 | 0 |
| 1. January 2025 | 3 | 0 | 0 |
| 31. December 2024 | 3 | 0 | 0 |
| 30. December 2024 | 3 | 0 | 0 |
| 29. December 2024 | 3 | 0 | 0 |
| 28. December 2024 | 3 | 0 | 0 |
| 27. December 2024 | 3 | 0 | 0 |
| 26. December 2024 | 3 | 0 | 0 |
Statistics on currently available industrial properties for rent in Lynge
In the table below, you see a series of data about available industrial properties to rent in Lynge.Also see gathered statistics of all available industrial properties in Lynge over time, the gathered statistics of new industrial properties in Lynge over time, the gathered statistics of rented industrial properties in Lynge over time
| Industrial properties | |
|---|---|
| Available premises | 5 |
| New premises since yesterday | 0 |
| Rented out premises since yesterday | 0 |
| Total available m2 | 2,175 |
| Average price per m2 per year without expenses | 94 |
| Highest price per m2 per year | 103 |
| Lowest price per m2 per year | 80 |


