


Industrial property for rent, Slagelse, Region Zealand, Bogensevej 15
Bogensevej 15, 4200 Slagelse- Industrial property for rent
- 270 m2
- 11,250 DKK per month

- Industrial property for rent
- 270 m2
- 11,250 DKK per month
Industrial property for rent, Slagelse, Region Zealand, Bogensevej 15
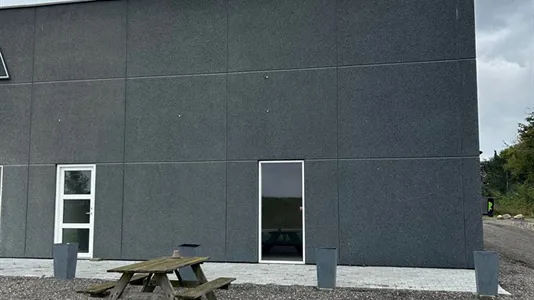
Lejemål fra 200 til 2.000 m2 med facade mod Kalundborgvej
Bygningerne har facade direkte mod Kalundborgvej, med over 7.000 passerende biler i døgnet.
Kan anvendes til industri- og værkstedsvirksomhed, entreprenør- og anlægsvirksomhed, grovvarehandel samt andre tilsvarende erhvervstyper. Nogle lokaler anvendes til lager- og engros salg, showrooms i tilknytning til webshop og lignende.
Lejen udgør ca. 500 kr./m2/året + forbrug.
Information and data
This industrial property for rent, is located in Slagelse. Slagelse is located on Region Zealand. The company space is 270 m2 in total. You can rent this industrial property for 135,000 DKK per year.
Similar search results
-
400 m2 industrial property for rent in Slagelse, Region Zealand
- 20,833 DKK per month
- 625 DKK /m2/year
-
1675 m2 industrial property for rent in Slagelse, Region Zealand
- 79,583 DKK per month
- 570 DKK /m2/year
-
1185 m2 industrial property for rent in Slagelse, Region Zealand
- 58,333 DKK per month
- 590 DKK /m2/year
-
404 m2 industrial property for rent in Slagelse, Region Zealand
- 20,000 DKK per month
- 594 DKK /m2/year


Frequently asked questions
Statistics on the development of available industrial properties for rent in Slagelse over the past month
Below you can see the development of available industrial properties for rent in Slagelse over the past month. In the first column you see the date. In the second column you see the total amount of industrial properties for rent in Slagelse on the date. In the third column you see the amount of new industrial properties in Slagelse that was available for rent on the date. In the fourth column you see the amount of industrial properties in Slagelse that was rented on the date. Also see aggregate statistics on all available industrial properties in Slagelse over time, aggregate statistics on new industrial properties in Slagelse over time, aggregate statistics on rented industrial properties in Slagelse over time
| Date | All industrial properties for rent | New industrial properties for rent | Rented out industrial properties |
|---|---|---|---|
| 2. February 2025 | 11 | 0 | 0 |
| 1. February 2025 | 11 | 0 | 2 |
| 31. January 2025 | 13 | 0 | 0 |
| 30. January 2025 | 13 | 0 | 0 |
| 29. January 2025 | 13 | 0 | 0 |
| 28. January 2025 | 13 | 0 | 0 |
| 27. January 2025 | 13 | 0 | 0 |
| 26. January 2025 | 13 | 0 | 0 |
| 25. January 2025 | 13 | 0 | 0 |
| 24. January 2025 | 13 | 1 | 0 |
| 23. January 2025 | 12 | 0 | 1 |
| 22. January 2025 | 13 | 1 | 0 |
| 21. January 2025 | 12 | 0 | 1 |
| 20. January 2025 | 13 | 2 | 0 |
| 19. January 2025 | 11 | 0 | 2 |
| 18. January 2025 | 13 | 0 | 0 |
| 17. January 2025 | 13 | 3 | 0 |
| 16. January 2025 | 10 | 0 | 1 |
| 15. January 2025 | 11 | 0 | 2 |
| 14. January 2025 | 13 | 0 | 0 |
| 13. January 2025 | 13 | 0 | 0 |
| 12. January 2025 | 13 | 1 | 0 |
| 11. January 2025 | 12 | 0 | 1 |
| 10. January 2025 | 13 | 0 | 0 |
| 9. January 2025 | 13 | 0 | 0 |
| 8. January 2025 | 13 | 0 | 0 |
| 7. January 2025 | 13 | 1 | 0 |
| 6. January 2025 | 12 | 0 | 1 |
| 5. January 2025 | 13 | 0 | 0 |
| 4. January 2025 | 13 | 0 | 0 |
| 3. January 2025 | 13 | 0 | 0 |
Statistics on currently available industrial properties for rent in Slagelse
In the table below, you see a series of data about available industrial properties to rent in Slagelse.Also see gathered statistics of all available industrial properties in Slagelse over time, the gathered statistics of new industrial properties in Slagelse over time, the gathered statistics of rented industrial properties in Slagelse over time
| Industrial properties | |
|---|---|
| Available premises | 13 |
| New premises since yesterday | 0 |
| Rented out premises since yesterday | 0 |
| Total available m2 | 9,645 |
| Average price per m2 per year without expenses | 70 |
| Highest price per m2 per year | 84 |
| Lowest price per m2 per year | 22 |