


Industrial property for rent, Them, Central Jutland Region, Enebærvej 7
Enebærvej 7, 8653 Them- Industrial property for rent
- 445 m2
- 10,000 DKK per month

- Industrial property for rent
- 445 m2
- 10,000 DKK per month
This commercial rental is no longer available.
Search for similar premises on Companyspace.com
Industrial property for rent, Them, Central Jutland Region, Enebærvej 7
Værksted/lager i Knudlund
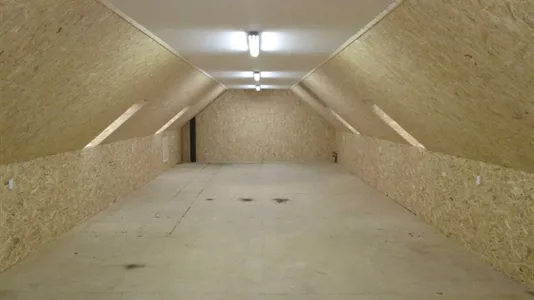
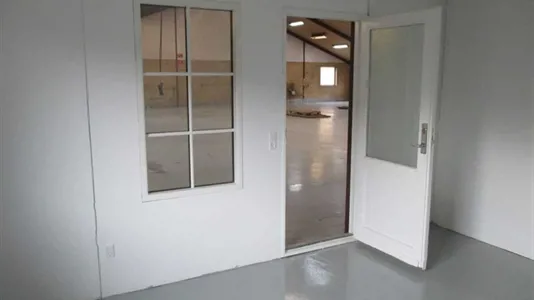
Lager/værksted/produktion på 370 m2 + lagerrum på 1. sal på 75 m2, toilet og kontor, el port H. 4,80m, B 3,60m.
Pris 10.000 kr. + moms Beliggende Silkeborg Syd (Knudlund)
Information and data
This industrial property for rent, that can also be used as Warehouse, is located on Enebærvej in Them. Them is located in Central Jutland Region. The company space is 445 m2 in total. You can rent this industrial property for 120,000 DKK per year.
Similar search results
-
110 m2 shop for rent in Them, Central Jutland Region, Rodelundvej

- 10,000 DKK per month
- 1,090 DKK /m2/year
-
1309 m2 warehouse for rent in Them, Central Jutland Region, Knudlundvej
- 17,999 DKK per month
- 165 DKK /m2/year
-
300 m2 office space for rent in Them, Central Jutland Region, Erhvervsvej
- 18,750 DKK per month
- 750 DKK /m2/year
-
1930 m2 office space for rent in Them, Central Jutland Region, Erhvervsvej
- 111,779 DKK per month
- 695 DKK /m2/year
-
1175 m2 office space for rent in Them, Central Jutland Region, Klintevej
- 38,677 DKK per month
- 395 DKK /m2/year
-
555 m2 office space for rent in Them, Central Jutland Region, Klintevej
- 18,269 DKK per month
- 395 DKK /m2/year
-
198 m2 office space for rent in Them, Central Jutland Region, Klintevej
- 6,518 DKK per month
- 395 DKK /m2/year


Frequently asked questions
Statistics on the development of available industrial properties for rent in Them over the past month
Below you can see the development of available industrial properties for rent in Them over the past month. In the first column you see the date. In the second column you see the total amount of industrial properties for rent in Them on the date. In the third column you see the amount of new industrial properties in Them that was available for rent on the date. In the fourth column you see the amount of industrial properties in Them that was rented on the date. Also see aggregate statistics on all available industrial properties in Them over time, aggregate statistics on new industrial properties in Them over time, aggregate statistics on rented industrial properties in Them over time
| Date | All industrial properties for rent | New industrial properties for rent | Rented out industrial properties |
|---|---|---|---|
| 29. September 2024 | 1 | 0 | 0 |
| 28. September 2024 | 1 | 0 | 0 |
| 27. September 2024 | 1 | 0 | 0 |
| 26. September 2024 | 1 | 0 | 0 |
| 25. September 2024 | 1 | 0 | 0 |
| 24. September 2024 | 1 | 0 | 0 |
| 23. September 2024 | 1 | 0 | 0 |
| 22. September 2024 | 1 | 0 | 0 |
| 21. September 2024 | 1 | 0 | 0 |
| 20. September 2024 | 1 | 0 | 0 |
| 19. September 2024 | 1 | 0 | 0 |
| 18. September 2024 | 1 | 0 | 0 |
| 17. September 2024 | 1 | 0 | 0 |
| 16. September 2024 | 1 | 0 | 0 |
| 15. September 2024 | 1 | 0 | 0 |
| 14. September 2024 | 1 | 0 | 0 |
| 13. September 2024 | 1 | 0 | 0 |
| 12. September 2024 | 1 | 0 | 0 |
| 11. September 2024 | 1 | 0 | 0 |
| 10. September 2024 | 1 | 0 | 0 |
| 9. September 2024 | 1 | 0 | 0 |
| 8. September 2024 | 1 | 0 | 0 |
| 7. September 2024 | 1 | 0 | 0 |
| 6. September 2024 | 1 | 0 | 0 |
| 5. September 2024 | 1 | 0 | 0 |
| 4. September 2024 | 1 | 0 | 0 |
| 3. September 2024 | 1 | 0 | 0 |
| 2. September 2024 | 1 | 0 | 0 |
| 1. September 2024 | 1 | 0 | 1 |
| 31. August 2024 | 2 | 0 | 0 |
| 30. August 2024 | 2 | 0 | 0 |
Statistics on currently available industrial properties for rent in Them
In the table below, you see a series of data about available industrial properties to rent in Them.Also see gathered statistics of all available industrial properties in Them over time, the gathered statistics of new industrial properties in Them over time, the gathered statistics of rented industrial properties in Them over time
| Industrial properties | |
|---|---|
| Available premises | 1 |
| New premises since yesterday | 0 |
| Rented out premises since yesterday | 0 |
| Total available m2 | 80 |
| Average price per m2 per year without expenses | 0 |
| Highest price per m2 per year | 0 |
| Lowest price per m2 per year | 0 |