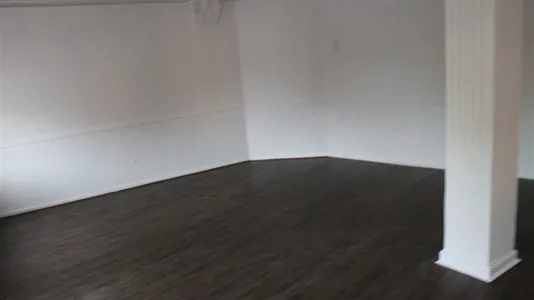
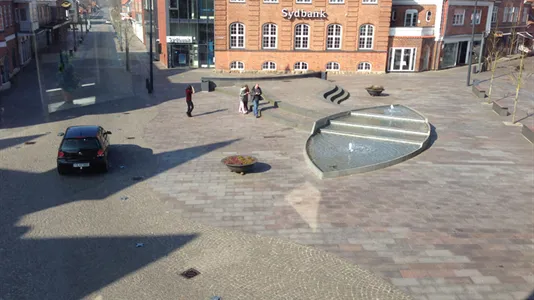
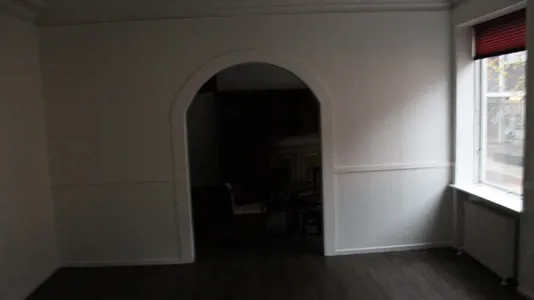
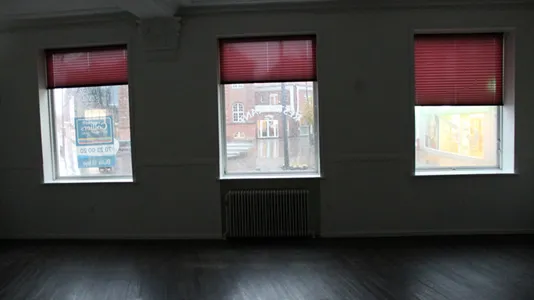
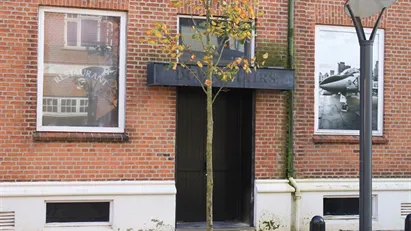
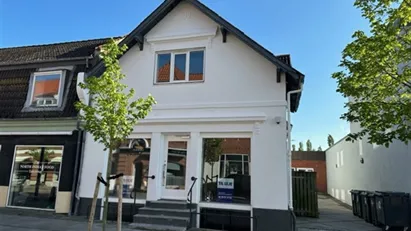
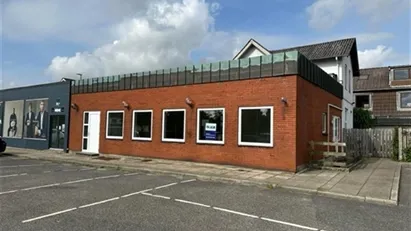
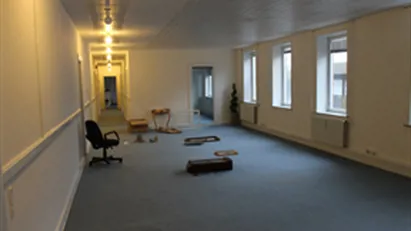
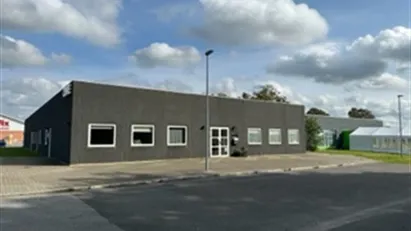
Photo provided by Google Street View and may be inaccurate:
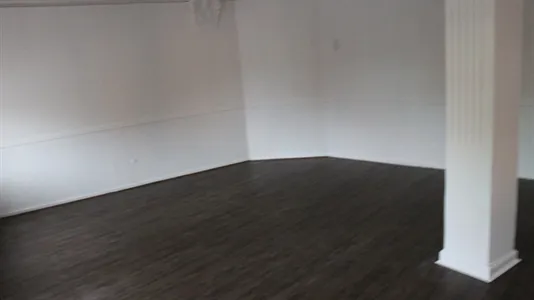
Restaurant for rent, Grindsted, Region of Southern Denmark, Borgergade 1
Borgergade 1, 7200 Grindsted- Restaurant for rent
- 300 m2
- 14,000 DKK per month
Restaurant for rent, Grindsted, Region of Southern Denmark, Borgergade 1
Restaurant/café - Byens bedste beliggenhed!
Her er en unik mulighed for etablere en byens bedste restaurant eller café.
Beliggenheden er super - lige midt på torvet i Grindsted med mulighed for udeservering.
Mulighed for trappeleje.
Attraktive vilkår for det rette koncept.
Find mine kontaktoplysninger på glasogflasker . dk
Beliggenheden er super - lige midt på torvet i Grindsted med mulighed for udeservering.
Mulighed for trappeleje.
Attraktive vilkår for det rette koncept.
Find mine kontaktoplysninger på glasogflasker . dk
Information and data
This restaurant for rent, that can also be used as Shop, is located in Grindsted. Grindsted is located in the municipality , which is located in Region of Southern Denmark. The company space is 300 m2 in total. You can rent this restaurant for 168,000 DKK per year.
Similar search results
-
130 m2 shop for rent in Grindsted, Region of Southern Denmark
- 4,000 DKK per month
- 369 DKK /m2/year
-
220 m2 office space for rent in Grindsted, Region of Southern Denmark
- 8,000 DKK per month
- 436 DKK /m2/year
-
381 m2 office space for rent in Grindsted, Region of Southern Denmark
- 17,000 DKK per month
- 535 DKK /m2/year
-
55 m2 office space for rent in Grindsted, Region of Southern Denmark
- 3,500 DKK per month
- 763 DKK /m2/year
-
220 m2 shop for rent in Grindsted, Region of Southern Denmark
- 8,011 DKK per month
- 437 DKK /m2/year
-
288 m2 restaurant for rent in Grindsted, Region of Southern Denmark
- 12,000 DKK per month
- 500 DKK /m2/year
-
280 m2 office space for rent in Grindsted, Region of Southern Denmark
- 11,667 DKK per month
- 500 DKK /m2/year


