


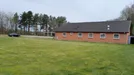
Photo provided by Google Street View and may be inaccurate:
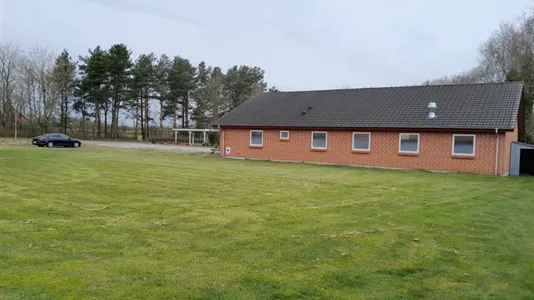
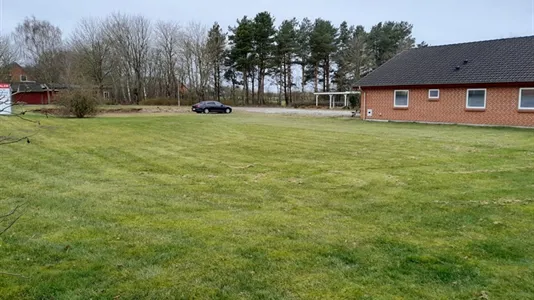
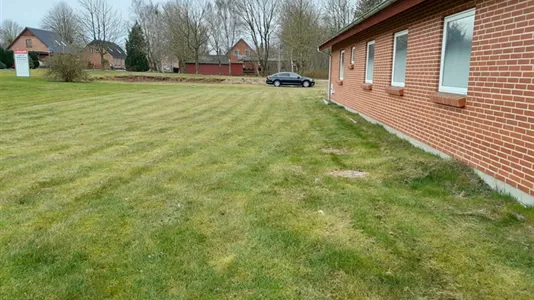


Restaurant for rent, Skive, Central Jutland Region, Bjerregårdsvej 2
Bjerregårdsvej 2, 7800 Skive- Restaurant for rent
- 120 m2
- 7,000 DKK per month
Restaurant for rent, Skive, Central Jutland Region, Bjerregårdsvej 2
Gode lokaler til mad ud af huset centralt i Vridsted-området
Tidligere anvendt til mad ud af huset med et godt kundegrundlag. Der er nye vandhaner og vandvarmer
Huset er fuldmuret og godt isoleret
Køkken udstyr
kølebord 3 skabe salatbord diverse rustfrit skåle stort emhætte. Godt med udenoms areal og p-plads
Klar til overtagelse lige nu.
Depositum kr 21000
Huset er fuldmuret og godt isoleret
Køkken udstyr
kølebord 3 skabe salatbord diverse rustfrit skåle stort emhætte. Godt med udenoms areal og p-plads
Klar til overtagelse lige nu.
Depositum kr 21000
Information and data
This restaurant for rent, that can also be used as Shop or Clinic, is located in Skive. Skive is located in the municipality , which is located in Central Jutland Region. The company space is 120 m2 in total. You can rent this restaurant for 84,000 DKK per year.
Similar search results
-
535 m2 restaurant for rent in Skive, Central Jutland Region
- 22,292 DKK per month
- 500 DKK /m2/year


