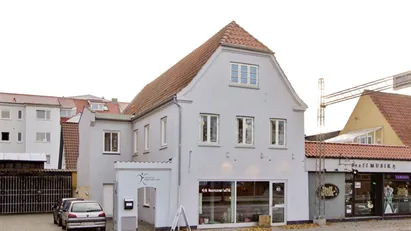
Shop for rent, Silkeborg, Central Jutland Region, Søndergade 11
Søndergade 11, 8600 Silkeborg- Shop for rent
- 123 m2
- 17,000 DKK per month
Fakta
ReportDirections
- 2228882
- Shop
- 123 m2
- 204,000 DKK
- 17,000 DKK
- 206,700 DKK
- 17,225 DKK
- 1,658 DKK
- 1,680 DKK
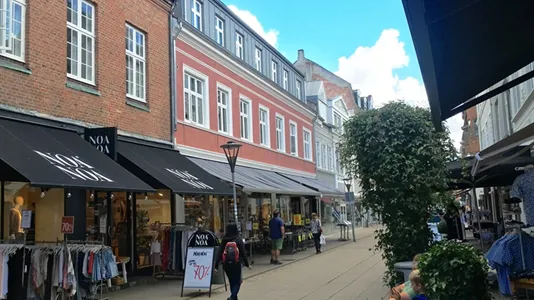
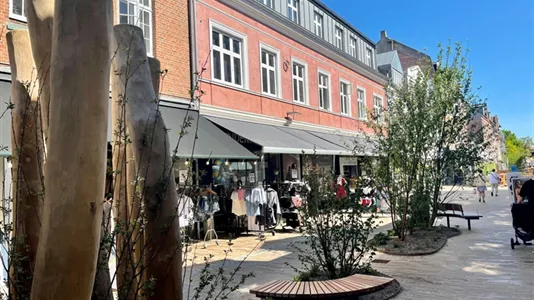
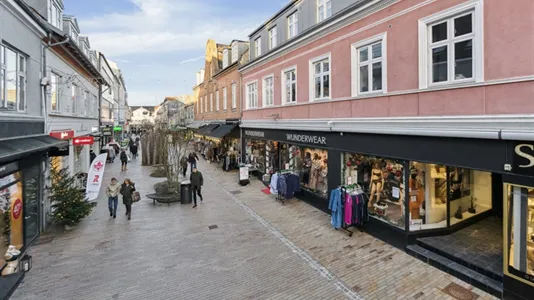
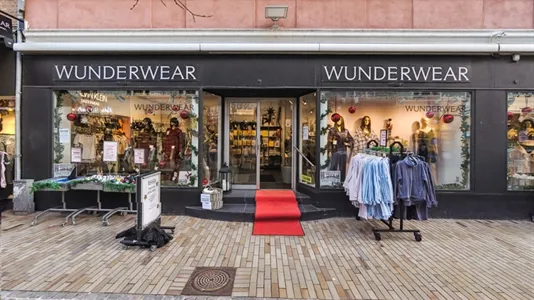
VELBELIGGENDE GÅGADEBUTIK – 123 m2 – CENTRALT PÅ SØNDERGADE
Mulighed for at leje yderligere 100 m2 lager i kælder.
Stort, flot – helt åbent butikslokale – niveaufrit – 120 m2 + køkken/toilet.
Totalrenoveret 2019 (Nyt gulv - Nyt loft med grundbelysning – Nyt køkken m.v.)
Adgang til hyggelig, lukket gårdmiljø med fælles solterrasse, aflåst cykelrum samt adgang til vaskeri.
Mulighed for leje af parkering. ligger helt centralt placeret på bedste del af Søndergade (gågaden) – kun et stenkast fra byens flotte torv med underjordisk parkering i 2 etager.
Information and data
This company space that can be used as Shop, is located on Søndergade in Silkeborg. Silkeborg is located in in Central Jutland Region. The company space is 123 m2 in total. You can rent this company space for 204,000 DKK per year.
Similar search results
-
635 m2 industrial property for rent in Silkeborg, Central Jutland Region, Viborgvej
- 12,000 DKK per month
- 226 DKK /m2/year
-
Warehouse for rent in Silkeborg, Central Jutland Region, Stagehøjvej
 This is a Platinum ad Read more
 -
15 m2 clinic for rent in Silkeborg, Central Jutland Region, Christian den
- 2,300 DKK per month
- 1,840 DKK /m2/year
-
167 m2 shop for rent in Silkeborg, Central Jutland Region, Vestergade
- 22,267 DKK per month
- 1,600 DKK /m2/year
-
228 m2 shop for rent in Silkeborg, Central Jutland Region, Søndergade
- 22,800 DKK per month
- 1,200 DKK /m2/year
-
214 m2 shop for rent in Silkeborg, Central Jutland Region, Søtorvet
- 23,183 DKK per month
- 1,300 DKK /m2/year
-
179 m2 shop for rent in Silkeborg, Central Jutland Region, Søtorvet
- 19,392 DKK per month
- 1,300 DKK /m2/year
-
295 m2 shop for rent in Silkeborg, Central Jutland Region, Viborgvej
- 28,808 DKK per month
- 1,171 DKK /m2/year
Frequently asked questions
Statistics on the development of available shops for rent in Silkeborg over the past month
Below you can see the development of available shops for rent in Silkeborg over the past month. In the first column you see the date. In the second column you see the total amount of shops for rent in Silkeborg on the date. In the third column you see the amount of new shops in Silkeborg that was available for rent on the date. In the fourth column you see the amount of shops in Silkeborg that was rented on the date. Also see aggregate statistics on all available shops in Silkeborg over time, aggregate statistics on new shops in Silkeborg over time, aggregate statistics on rented shops in Silkeborg over time
| Date | All shops for rent | New shops for rent | Rented out shops |
|---|---|---|---|
| 16. November 2024 | 25 | 0 | 1 |
| 15. November 2024 | 26 | 0 | 0 |
| 14. November 2024 | 26 | 4 | 0 |
| 13. November 2024 | 22 | 0 | 0 |
| 12. November 2024 | 22 | 1 | 5 |
| 11. November 2024 | 26 | 4 | 0 |
| 10. November 2024 | 22 | 0 | 3 |
| 9. November 2024 | 25 | 1 | 0 |
| 8. November 2024 | 24 | 0 | 0 |
| 7. November 2024 | 24 | 0 | 1 |
| 6. November 2024 | 25 | 0 | 0 |
| 5. November 2024 | 25 | 1 | 0 |
| 4. November 2024 | 24 | 0 | 0 |
| 3. November 2024 | 24 | 0 | 1 |
| 2. November 2024 | 25 | 0 | 0 |
| 1. November 2024 | 25 | 0 | 0 |
| 31. October 2024 | 25 | 0 | 0 |
| 30. October 2024 | 25 | 0 | 0 |
| 29. October 2024 | 25 | 0 | 0 |
| 28. October 2024 | 25 | 0 | 0 |
| 27. October 2024 | 25 | 0 | 0 |
| 26. October 2024 | 25 | 0 | 1 |
| 25. October 2024 | 26 | 0 | 0 |
| 24. October 2024 | 26 | 1 | 1 |
| 23. October 2024 | 26 | 1 | 0 |
| 22. October 2024 | 25 | 0 | 0 |
| 21. October 2024 | 25 | 0 | 0 |
| 20. October 2024 | 25 | 0 | 0 |
| 19. October 2024 | 25 | 0 | 0 |
| 18. October 2024 | 25 | 0 | 0 |
| 17. October 2024 | 25 | 0 | 0 |
Statistics on currently available shops for rent in Silkeborg
In the table below, you see a series of data about available shops to rent in Silkeborg.Also see gathered statistics of all available shops in Silkeborg over time, the gathered statistics of new shops in Silkeborg over time, the gathered statistics of rented shops in Silkeborg over time
| Shops | |
|---|---|
| Available premises | 24 |
| New premises since yesterday | 0 |
| Rented out premises since yesterday | 1 |
| Total available m2 | 5,889 |
| Average price per m2 per year without expenses | 163 |
| Highest price per m2 per year | 320 |
| Lowest price per m2 per year | 52 |


