


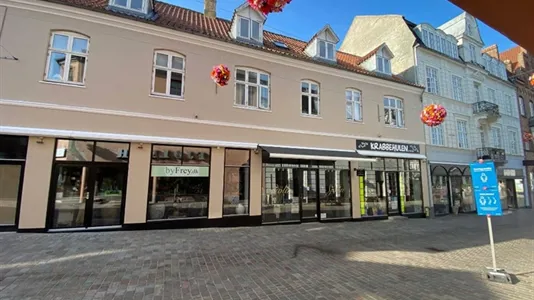
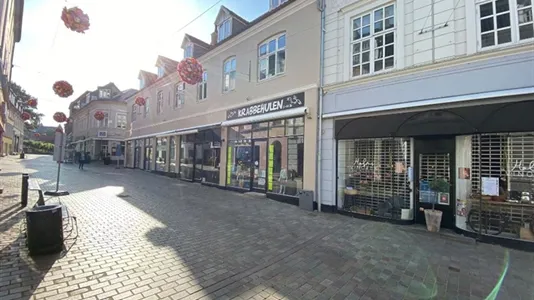


Shop for rent, Viborg, Central Jutland Region, Sct. Mathias Gade 72B
Sct. Mathias Gade 72B, 8800 Viborg- Shop for rent
- 102 m2
- 7,000 DKK per month

Shop for rent, Viborg, Central Jutland Region, Sct. Mathias Gade 72B
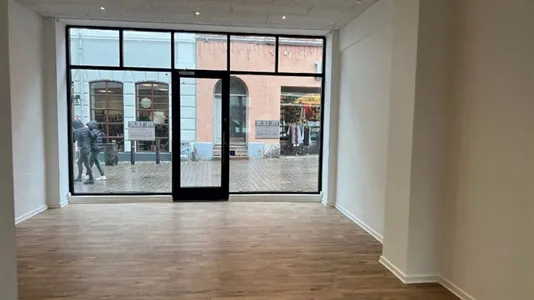
BUTIKSLEJEMÅL TÆT VED HJULTORVET - I ALT 102 KVM
Spændende og attraktivt butikslejemål med en absolut TOP placering i Viborgs hyggelige gågade.
Lejemålet består af et åbent, lyst butikslokale med store facadevinduer og gode udstillingsmuligheder. Baglokale, personalefaciliteter samt lager i kælderen.
Beliggende ved Hjultorvet i Viborgs centrum et af byens travle torve omkranset af butikker, restauranter og caféer, og dermed centrum for mange besøgende, både i hverdage og weekender. Den store granittrappe Kirkeskulpturen er om sommeren ofte pakket af mennesker, der tager en velfortjent pause.
Et lejemål med en attraktiv startleje.
Information and data
This company space that can be used as Shop, is located in Viborg. Viborg is located in in Central Jutland Region. The company space is 102 m2 in total. You can rent this company space for 84,000 DKK per year.
Similar search results
-
970 m2 office space for rent in Viborg, Central Jutland Region

- 97,000 DKK per month
- 1,200 DKK /m2/year


Frequently asked questions
Statistics on the development of available shops for rent in Viborg over the past month
Below you can see the development of available shops for rent in Viborg over the past month. In the first column you see the date. In the second column you see the total amount of shops for rent in Viborg on the date. In the third column you see the amount of new shops in Viborg that was available for rent on the date. In the fourth column you see the amount of shops in Viborg that was rented on the date. Also see aggregate statistics on all available shops in Viborg over time, aggregate statistics on new shops in Viborg over time, aggregate statistics on rented shops in Viborg over time
| Date | All shops for rent | New shops for rent | Rented out shops |
|---|---|---|---|
| 8. March 2025 | 71 | 0 | 1 |
| 7. March 2025 | 72 | 7 | 0 |
| 6. March 2025 | 65 | 4 | 4 |
| 5. March 2025 | 65 | 11 | 0 |
| 4. March 2025 | 54 | 0 | 12 |
| 3. March 2025 | 66 | 0 | 4 |
| 2. March 2025 | 70 | 2 | 2 |
| 1. March 2025 | 70 | 4 | 0 |
| 28. February 2025 | 66 | 0 | 4 |
| 27. February 2025 | 70 | 0 | 0 |
| 26. February 2025 | 70 | 1 | 1 |
| 25. February 2025 | 70 | 0 | 1 |
| 24. February 2025 | 71 | 0 | 1 |
| 23. February 2025 | 72 | 0 | 0 |
| 22. February 2025 | 72 | 0 | 0 |
| 21. February 2025 | 72 | 7 | 0 |
| 20. February 2025 | 65 | 4 | 7 |
| 19. February 2025 | 68 | 0 | 0 |
| 18. February 2025 | 68 | 2 | 6 |
| 17. February 2025 | 72 | 2 | 0 |
| 16. February 2025 | 70 | 10 | 0 |
| 15. February 2025 | 60 | 0 | 4 |
| 14. February 2025 | 64 | 7 | 7 |
| 13. February 2025 | 64 | 0 | 1 |
| 12. February 2025 | 65 | 6 | 4 |
| 11. February 2025 | 63 | 1 | 7 |
| 10. February 2025 | 69 | 0 | 0 |
| 9. February 2025 | 69 | 0 | 0 |
| 8. February 2025 | 69 | 4 | 0 |
| 7. February 2025 | 65 | 0 | 2 |
| 6. February 2025 | 67 | 0 | 0 |
Statistics on currently available shops for rent in Viborg
In the table below, you see a series of data about available shops to rent in Viborg.Also see gathered statistics of all available shops in Viborg over time, the gathered statistics of new shops in Viborg over time, the gathered statistics of rented shops in Viborg over time
| Shops | |
|---|---|
| Available premises | 73 |
| New premises since yesterday | 0 |
| Rented out premises since yesterday | 1 |
| Total available m2 | 26,039 |
| Average price per m2 per year without expenses | 115 |
| Highest price per m2 per year | 282 |
| Lowest price per m2 per year | 33 |