Available industrial properties
See all available industrial properties below. If you are looking for industrial property, you have come to the right place. We have almost all available industrial properties in our database. Find industrial property here. Enjoy.
17,781 industrial properties found
-
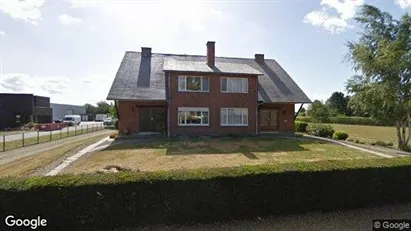
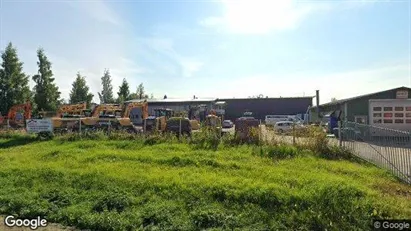
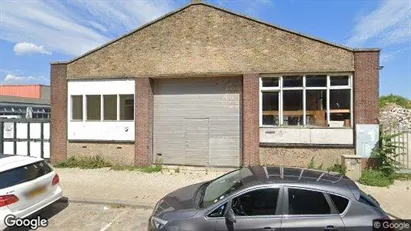
336 m2 industrial property for rent in Bree, Limburg
- 125 EUR per month
- 4.46 EUR /m2/year
-
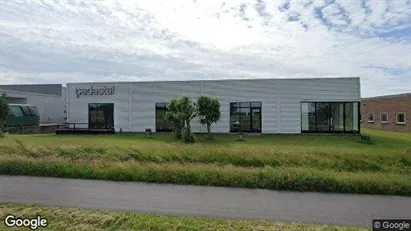
782 m2 warehouse for rent in Odense NØ, Odense
- 25,733 DKK per month
- 394 DKK /m2/year
-
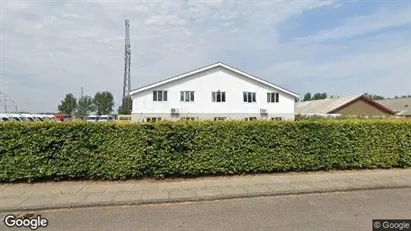
628 m2 warehouse for rent in Middelfart, Funen
- 22,250 DKK per month
- 425 DKK /m2/year
-
1644 m2 warehouse for rent in Egå, Aarhus
- 61,158 DKK per month
- 446 DKK /m2/year
-
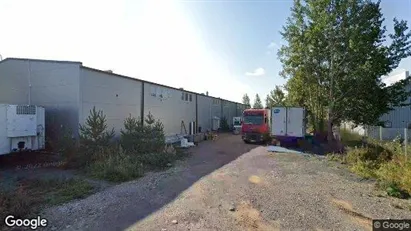
28 m2 industrial property for rent in Vantaa, Uusimaa
- 490 EUR per month
- 210 EUR /m2/year
-
28 m2 industrial property for rent in Vantaa, Uusimaa
- 490 EUR per month
- 210 EUR /m2/year
-
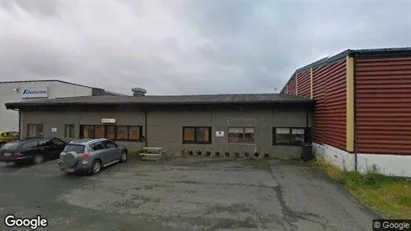
250 m2 industrial property for rent in Oulu, Pohjois-Pohjanmaa
- 1,500 EUR per month
- 72 EUR /m2/year
-
28 m2 industrial property for rent in Vantaa, Uusimaa
- 490 EUR per month
- 210 EUR /m2/year
-
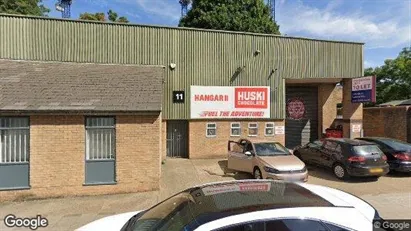
1950 m2 industrial property for rent in London SW8, Greater London
- 5,420 GBP per month
- 33.35 GBP /m2/year
-
28 m2 industrial property for rent in Vantaa, Uusimaa
- 510 EUR per month
- 218.57 EUR /m2/year
Frequently asked questions
Statistics on the development of available industrial properties for rent over the past month
Also see aggregate statistics on all available industrial properties over time, aggregate statistics on new industrial properties over time, aggregate statistics on rented industrial properties over time
| Date | |||
|---|---|---|---|
| 12. March 2025 | 17757 | 235 | 362 |
| 11. March 2025 | 17884 | 100 | 66 |
| 10. March 2025 | 17850 | 121 | 95 |
| 9. March 2025 | 17824 | 243 | 208 |
| 8. March 2025 | 17789 | 0 | 3 |
| 7. March 2025 | 17792 | 257 | 225 |
| 6. March 2025 | 17760 | 245 | 212 |
| 5. March 2025 | 17727 | 374 | 375 |
| 4. March 2025 | 17728 | 156 | 91 |
| 3. March 2025 | 17663 | 191 | 190 |
| 2. March 2025 | 17662 | 90 | 118 |
| 1. March 2025 | 17690 | 370 | 356 |
| 28. February 2025 | 17676 | 232 | 139 |
| 27. February 2025 | 17583 | 228 | 317 |
| 26. February 2025 | 17672 | 245 | 156 |
| 25. February 2025 | 17583 | 136 | 147 |
| 24. February 2025 | 17594 | 247 | 132 |
| 23. February 2025 | 17479 | 484 | 435 |
| 22. February 2025 | 17430 | 216 | 69 |
| 21. February 2025 | 17283 | 403 | 275 |
| 20. February 2025 | 17155 | 437 | 849 |
| 19. February 2025 | 17567 | 252 | 53 |
| 18. February 2025 | 17368 | 60 | 85 |
| 17. February 2025 | 17393 | 287 | 267 |
| 16. February 2025 | 17373 | 244 | 175 |
| 15. February 2025 | 17304 | 189 | 312 |
| 14. February 2025 | 17427 | 548 | 414 |
| 13. February 2025 | 17293 | 210 | 212 |
| 12. February 2025 | 17295 | 350 | 500 |
| 11. February 2025 | 17445 | 109 | 0 |
| 10. February 2025 | 17336 | 88 | 0 |
Statistics on currently available industrial properties
Also see gathered statistics of all available industrial properties over time, the gathered statistics of new industrial properties over time, the gathered statistics of rented industrial properties over time
| Industrial properties | |
|---|---|
| Available premises | 17,697 |
| New premises since yesterday | 235 |
| Rented out premises since yesterday | 362 |
| Total available m2 | 59,588,121 |
| Average price per m2 per year without expenses | 1,904 |
| Highest price per m2 per year | 1,980,000 |
| Lowest price per m2 per year | 1 |


