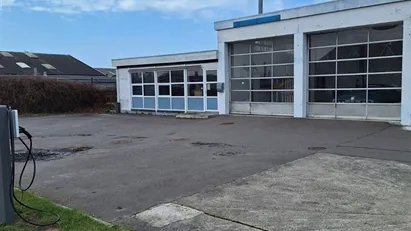
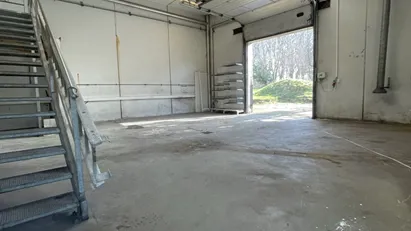
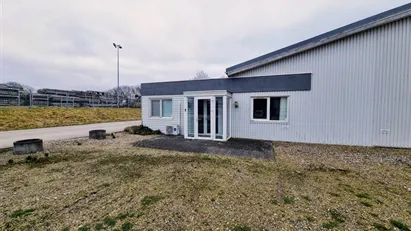
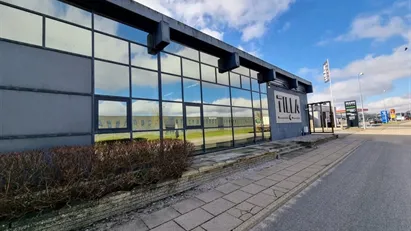
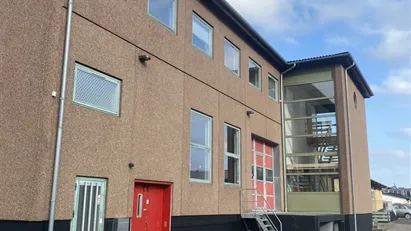
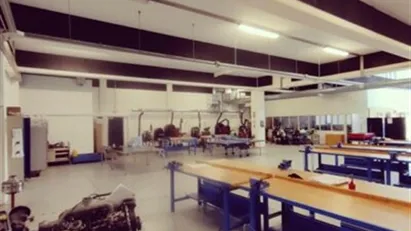
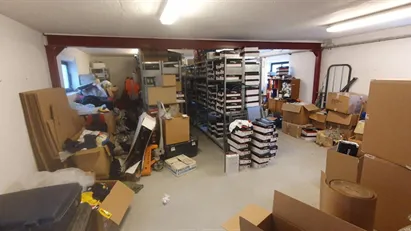
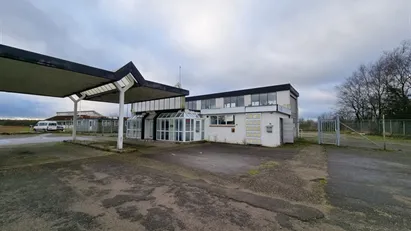
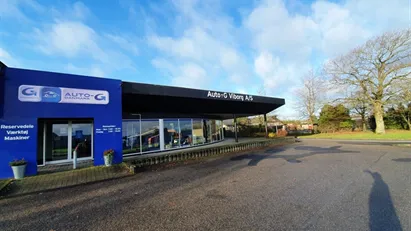
Available industrial properties
See all available industrial properties below. If you are looking for industrial property, you have come to the right place. We have almost all available industrial properties in our database. Find industrial property here. Enjoy.
17,758 industrial properties found
-
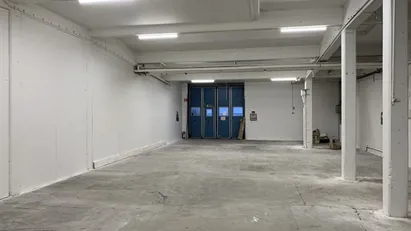
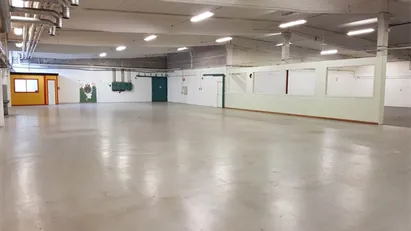
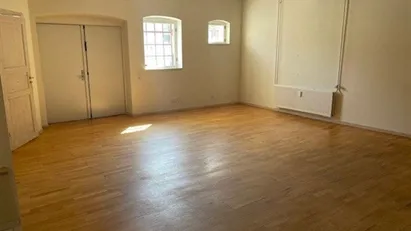
215 m2 industrial property for rent in Perstorp, Skåne County
- 6,900 SEK per month
- 385 SEK /m2/year
-
122 m2 industrial property for rent in Linköping, Östergötland County
- 11,183 SEK per month
- 1,100 SEK /m2/year
-
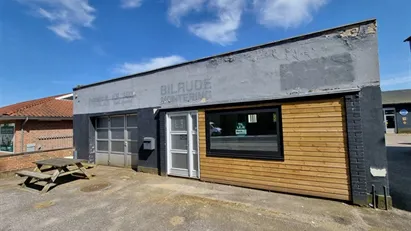
150 m2 industrial property for rent in Viborg, Central Jutland Region
- 6,250 DKK per month
- 500 DKK /m2/year
-
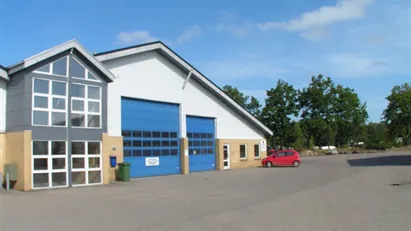
1718 m2 industrial property for rent in Viborg, Central Jutland Region
- 42,950 DKK per month
- 300 DKK /m2/year
-
633 m2 industrial property for rent in Rønne, Bornholm
- 15,825 DKK per month
- 300 DKK /m2/year
-
120 m2 warehouse for rent in Vejle, Vejle (region)
- 6,500 DKK per month
- 650 DKK /m2/year
-
312 m2 industrial property for rent in Højslev, Central Jutland Region
- 9,095 DKK per month
- 349 DKK /m2/year
-
902 m2 industrial property for rent in Viborg, Central Jutland Region
- 28,000 DKK per month
- 372 DKK /m2/year
-
1100 m2 industrial property for rent in Farum, North Zealand
- 57,000 DKK per month
- 621 DKK /m2/year
-
80 m2 warehouse for rent in Hundested, North Zealand
- 3,600 DKK per month
- 540 DKK /m2/year
-
205 m2 industrial property for rent in Engesvang, Central Jutland Region
- 11,000 DKK per month
- 643 DKK /m2/year
-
1945 m2 industrial property for rent in Viborg, Central Jutland Region
- 55,000 DKK per month
- 339 DKK /m2/year
Frequently asked questions
Statistics on the development of available industrial properties for rent over the past month
Also see aggregate statistics on all available industrial properties over time, aggregate statistics on new industrial properties over time, aggregate statistics on rented industrial properties over time
| Date | |||
|---|---|---|---|
| 5. March 2025 | 17727 | 374 | 375 |
| 4. March 2025 | 17728 | 156 | 91 |
| 3. March 2025 | 17663 | 191 | 190 |
| 2. March 2025 | 17662 | 90 | 118 |
| 1. March 2025 | 17690 | 370 | 356 |
| 28. February 2025 | 17676 | 232 | 139 |
| 27. February 2025 | 17583 | 228 | 317 |
| 26. February 2025 | 17672 | 245 | 156 |
| 25. February 2025 | 17583 | 136 | 147 |
| 24. February 2025 | 17594 | 247 | 132 |
| 23. February 2025 | 17479 | 484 | 435 |
| 22. February 2025 | 17430 | 216 | 69 |
| 21. February 2025 | 17283 | 403 | 275 |
| 20. February 2025 | 17155 | 437 | 849 |
| 19. February 2025 | 17567 | 252 | 53 |
| 18. February 2025 | 17368 | 60 | 85 |
| 17. February 2025 | 17393 | 287 | 267 |
| 16. February 2025 | 17373 | 244 | 175 |
| 15. February 2025 | 17304 | 189 | 312 |
| 14. February 2025 | 17427 | 548 | 414 |
| 13. February 2025 | 17293 | 210 | 212 |
| 12. February 2025 | 17295 | 350 | 500 |
| 11. February 2025 | 17445 | 109 | 0 |
| 10. February 2025 | 17336 | 88 | 267 |
| 9. February 2025 | 17515 | 254 | 176 |
| 8. February 2025 | 17437 | 357 | 328 |
| 7. February 2025 | 17408 | 472 | 433 |
| 6. February 2025 | 17369 | 338 | 104 |
| 5. February 2025 | 17135 | 358 | 250 |
| 4. February 2025 | 17027 | 116 | 214 |
| 3. February 2025 | 17125 | 165 | 0 |
Statistics on currently available industrial properties
Also see gathered statistics of all available industrial properties over time, the gathered statistics of new industrial properties over time, the gathered statistics of rented industrial properties over time
| Industrial properties | |
|---|---|
| Available premises | 17,731 |
| New premises since yesterday | 374 |
| Rented out premises since yesterday | 375 |
| Total available m2 | 57,981,336 |
| Average price per m2 per year without expenses | 1,970 |
| Highest price per m2 per year | 1,980,000 |
| Lowest price per m2 per year | 1 |


