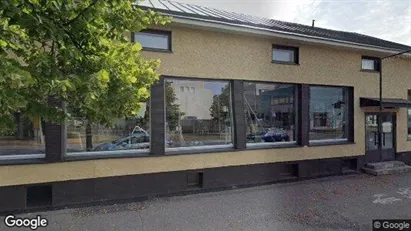
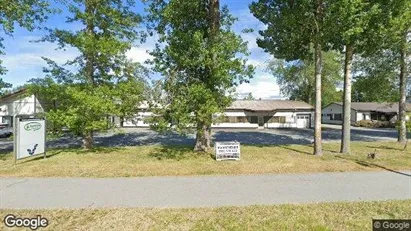
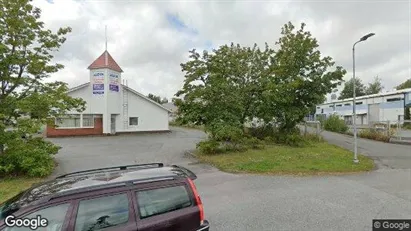
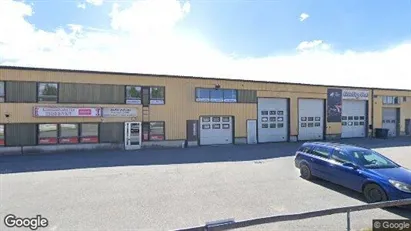
Available industrial properties
See all available industrial properties below. If you are looking for industrial property, you have come to the right place. We have almost all available industrial properties in our database. Find industrial property here. Enjoy.
17,706 industrial properties found
-
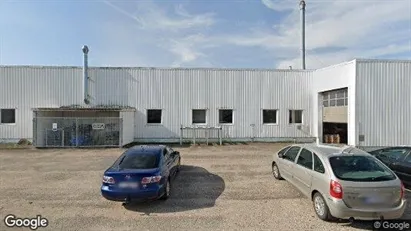
135 m2 industrial property for rent in Ullerslev, Funen
- 5,000 DKK per month
- 444 DKK /m2/year
-
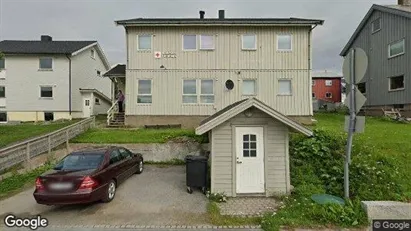
1910 m2 office space for rent in Ballerup, Greater Copenhagen
- 103,458 DKK per month
- 650 DKK /m2/year
-
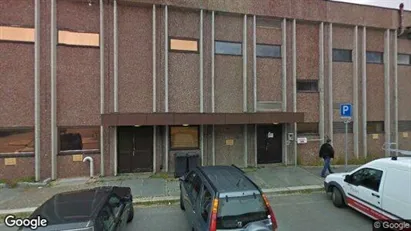
403 m2 warehouse for rent in Vissenbjerg, Funen
- 11,330 DKK per month
- 337 DKK /m2/year
-
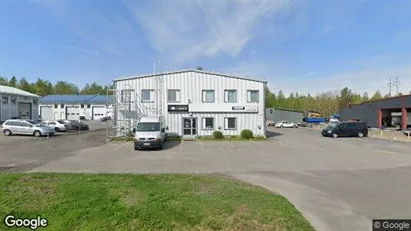
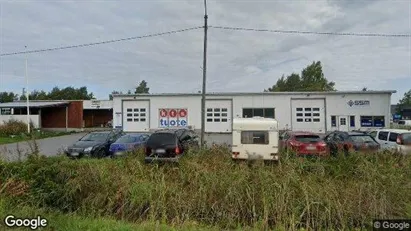
28 m2 industrial property for rent in Vantaa, Uusimaa
- 510 EUR per month
- 218.57 EUR /m2/year
-
112 m2 industrial property for rent in Oulu, Pohjois-Pohjanmaa
- 890 EUR per month
- 95.36 EUR /m2/year
-
28 m2 industrial property for rent in Vantaa, Uusimaa
- 490 EUR per month
- 210 EUR /m2/year
-
1200 m2 industrial property for rent in Pori, Satakunta
- 7,000 EUR per month
- 70 EUR /m2/year
-
79 m2 industrial property for rent in Pori, Satakunta
- 950 EUR per month
- 144.30 EUR /m2/year
-
110 m2 industrial property for rent in Ulvila, Satakunta
- 400 EUR per month
- 43.64 EUR /m2/year
-
400 m2 industrial property for rent in Pori, Satakunta
- 1,690 EUR per month
- 50.70 EUR /m2/year
-
83 m2 industrial property for rent in Pori, Satakunta
- 750 EUR per month
- 108.43 EUR /m2/year
-
270 m2 industrial property for rent in Pori, Satakunta
- 1,200 EUR per month
- 53.33 EUR /m2/year
-
126 m2 industrial property for rent in Pori, Satakunta
- 1,050 EUR per month
- 100 EUR /m2/year
-
240 m2 industrial property for rent in Pori, Satakunta
- 950 EUR per month
- 47.50 EUR /m2/year
-
50 m2 industrial property for rent in Pori, Satakunta
- 580 EUR per month
- 139.20 EUR /m2/year
Frequently asked questions
Statistics on the development of available industrial properties for rent over the past month
Also see aggregate statistics on all available industrial properties over time, aggregate statistics on new industrial properties over time, aggregate statistics on rented industrial properties over time
| Date | |||
|---|---|---|---|
| 12. March 2025 | 17757 | 235 | 362 |
| 11. March 2025 | 17884 | 100 | 66 |
| 10. March 2025 | 17850 | 121 | 95 |
| 9. March 2025 | 17824 | 243 | 208 |
| 8. March 2025 | 17789 | 0 | 3 |
| 7. March 2025 | 17792 | 257 | 225 |
| 6. March 2025 | 17760 | 245 | 212 |
| 5. March 2025 | 17727 | 374 | 375 |
| 4. March 2025 | 17728 | 156 | 91 |
| 3. March 2025 | 17663 | 191 | 190 |
| 2. March 2025 | 17662 | 90 | 118 |
| 1. March 2025 | 17690 | 370 | 356 |
| 28. February 2025 | 17676 | 232 | 139 |
| 27. February 2025 | 17583 | 228 | 317 |
| 26. February 2025 | 17672 | 245 | 156 |
| 25. February 2025 | 17583 | 136 | 147 |
| 24. February 2025 | 17594 | 247 | 132 |
| 23. February 2025 | 17479 | 484 | 435 |
| 22. February 2025 | 17430 | 216 | 69 |
| 21. February 2025 | 17283 | 403 | 275 |
| 20. February 2025 | 17155 | 437 | 849 |
| 19. February 2025 | 17567 | 252 | 53 |
| 18. February 2025 | 17368 | 60 | 85 |
| 17. February 2025 | 17393 | 287 | 267 |
| 16. February 2025 | 17373 | 244 | 175 |
| 15. February 2025 | 17304 | 189 | 312 |
| 14. February 2025 | 17427 | 548 | 414 |
| 13. February 2025 | 17293 | 210 | 212 |
| 12. February 2025 | 17295 | 350 | 500 |
| 11. February 2025 | 17445 | 109 | 0 |
| 10. February 2025 | 17336 | 88 | 0 |
Statistics on currently available industrial properties
Also see gathered statistics of all available industrial properties over time, the gathered statistics of new industrial properties over time, the gathered statistics of rented industrial properties over time
| Industrial properties | |
|---|---|
| Available premises | 17,697 |
| New premises since yesterday | 235 |
| Rented out premises since yesterday | 362 |
| Total available m2 | 59,588,121 |
| Average price per m2 per year without expenses | 1,904 |
| Highest price per m2 per year | 1,980,000 |
| Lowest price per m2 per year | 1 |


