Available office spaces
See all available office spaces below. If you are looking for office space, you have come to the right place. We have most available office spaces in our database. Find office space here. Enjoy.
124,328 office spaces found
-
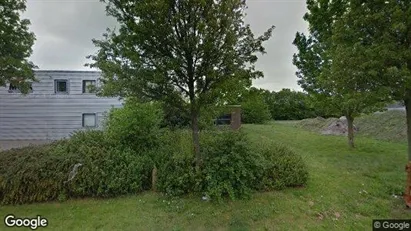
20 m2 office space for rent in De Fryske Marren, Friesland NL
- 300 EUR per month
- 180 EUR /m2/year
-
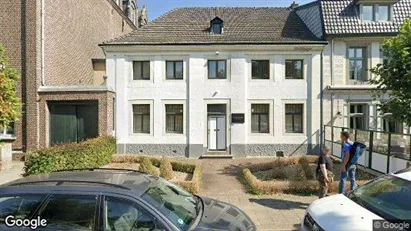
300 m2 office space for rent in Gulpen-Wittem, Limburg
- 1,950 EUR per month
- 78 EUR /m2/year
-
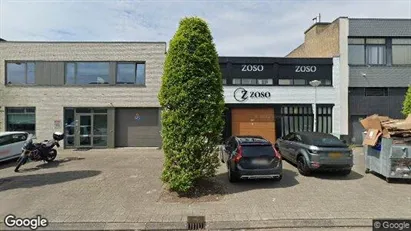
20 m2 office space for rent in Amsterdam Westpoort, Amsterdam
- 600 EUR per month
- 360 EUR /m2/year
-
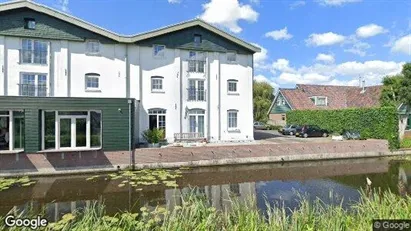
141 m2 office space for rent in Tilburg, North Brabant
- 1,700 EUR per month
- 144.68 EUR /m2/year
-
51 m2 office space for rent in Amsterdam Oud-West, Amsterdam
- 775 EUR per month
- 182.35 EUR /m2/year
-
1250 m2 office space for rent in Rønne, Bornholm
- 39,062 DKK per month
- 375 DKK /m2/year
-
41 m2 office space for rent in Amsterdam Centrum, Amsterdam
- 2,205 EUR per month
- 645.37 EUR /m2/year
-
490 m2 office space for rent in Breda, North Brabant
- 1,181 EUR per month
- 28.92 EUR /m2/year
-
245 m2 office space for rent in Waddinxveen, South Holland
- 2,458 EUR per month
- 120.41 EUR /m2/year
-
185 m2 office space for rent in Stockholm West, Stockholm
- 17,790 SEK per month
- 1,153 SEK /m2/year
-
337 m2 office space for rent in Allerød, North Zealand
- 23,169 DKK per month
- 825 DKK /m2/year
-
79 m2 office space for rent in Stockholm South, Stockholm
- 1,800 SEK per month
- 273 SEK /m2/year
-
687 m2 office space for rent in Herlev, Greater Copenhagen
- 56,964 DKK per month
- 995 DKK /m2/year
-
155 m2 office space for rent in Værløse, North Zealand
- 15,500 DKK per month
- 1,200 DKK /m2/year
-
58 m2 office space for rent in Helsingør, North Zealand
- 7,250 DKK per month
- 1,500 DKK /m2/year
Frequently asked questions
Statistics on the development of available office spaces for rent over the past month
Also see aggregate statistics on all available office spaces over time, aggregate statistics on new office spaces over time, aggregate statistics on rented office spaces over time
| Date | |||
|---|---|---|---|
| 9. August 2025 | 123945 | 2790 | 2287 |
| 8. August 2025 | 123442 | 1915 | 1841 |
| 7. August 2025 | 123368 | 2768 | 1640 |
| 6. August 2025 | 122240 | 1342 | 1880 |
| 5. August 2025 | 122778 | 1610 | 2709 |
| 4. August 2025 | 123877 | 1575 | 0 |
| 3. August 2025 | 122302 | 2106 | 2794 |
| 2. August 2025 | 122990 | 1193 | 1404 |
| 1. August 2025 | 123201 | 3030 | 2803 |
| 31. July 2025 | 122974 | 1206 | 793 |
| 30. July 2025 | 122561 | 1950 | 2557 |
| 29. July 2025 | 123168 | 894 | 581 |
| 28. July 2025 | 122855 | 1803 | 1383 |
| 27. July 2025 | 122435 | 1492 | 2696 |
| 26. July 2025 | 123639 | 1932 | 1813 |
| 25. July 2025 | 123520 | 706 | 825 |
| 24. July 2025 | 123639 | 1670 | 1513 |
| 23. July 2025 | 123482 | 1075 | 513 |
| 22. July 2025 | 122920 | 2975 | 2235 |
| 21. July 2025 | 122180 | 1684 | 2443 |
| 20. July 2025 | 122939 | 1058 | 1106 |
| 19. July 2025 | 122987 | 1183 | 1181 |
| 18. July 2025 | 122985 | 2399 | 2521 |
| 17. July 2025 | 123107 | 619 | 655 |
| 16. July 2025 | 123143 | 2203 | 2591 |
| 15. July 2025 | 123531 | 1491 | 1525 |
| 14. July 2025 | 123565 | 515 | 855 |
| 13. July 2025 | 123905 | 1602 | 1176 |
| 12. July 2025 | 123479 | 1694 | 1484 |
| 11. July 2025 | 123269 | 2451 | 2896 |
| 10. July 2025 | 123714 | 1235 | 0 |
Statistics on currently available office spaces
Also see gathered statistics of all available office spaces over time, the gathered statistics of new office spaces over time, the gathered statistics of rented office spaces over time
| Office spaces | |
|---|---|
| Available premises | 123,885 |
| New premises since yesterday | 2,790 |
| Rented out premises since yesterday | 2,287 |
| Total available m2 | 2,932,469,031 |
| Average price per m2 per year without expenses | 29,085 |
| Highest price per m2 per year | 45,000,000 |
| Lowest price per m2 per year | 1 |


