Available office spaces
See all available office spaces below. If you are looking for office space, you have come to the right place. We have most available office spaces in our database. Find office space here. Enjoy.
124,042 office spaces found
-
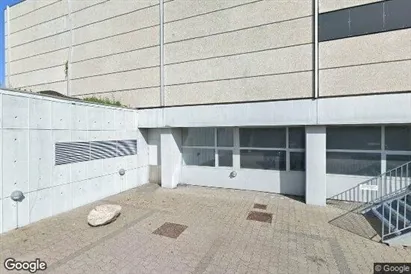
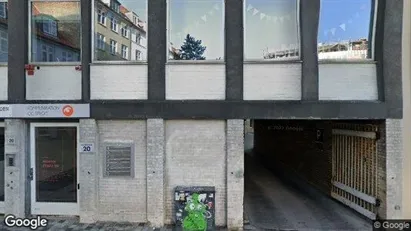
75 m2 office space for rent in Odense SØ, Odense
- 4,812 DKK per month
- 770 DKK /m2/year
-
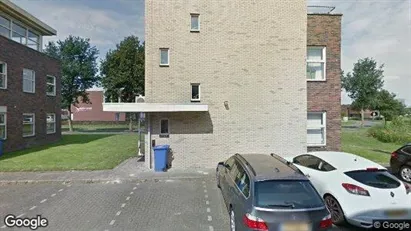
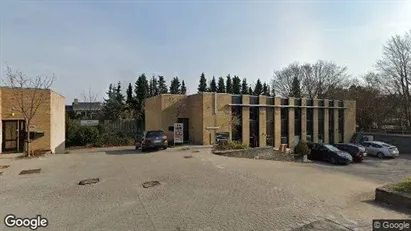
160 m2 office space for rent in Emmen, Drenthe
- 1,292 EUR per month
- 96.88 EUR /m2/year
-
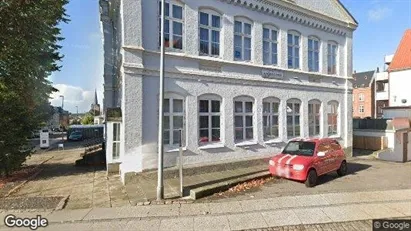
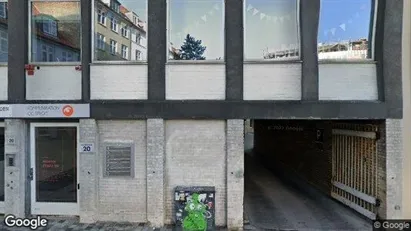
486 m2 office space for rent in Odense SØ, Odense
- 31,185 DKK per month
- 770 DKK /m2/year
-
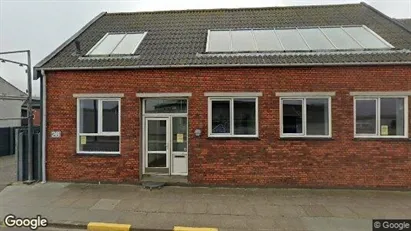
25 m2 office space for rent in Odense SØ, Odense
- 1,604 DKK per month
- 770 DKK /m2/year
-
499 m2 office space for rent in Odense SØ, Odense
- 32,019 DKK per month
- 770 DKK /m2/year
-
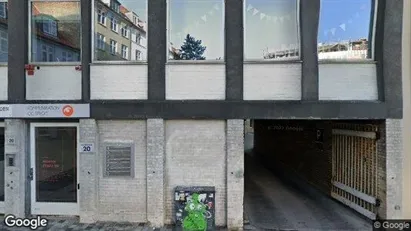
24 m2 office space for rent in Copenhagen K, Copenhagen
- 13,000 DKK per month
- 6,500 DKK /m2/year
-
223 m2 office space for rent in Brøndby, Greater Copenhagen
- 13,938 DKK per month
- 750 DKK /m2/year
-
72 m2 office space for rent in Copenhagen K, Copenhagen
- 35,000 DKK per month
- 5,833 DKK /m2/year
-
134 m2 office space for rent in Odense V, Odense
- 6,500 DKK per month
- 582 DKK /m2/year
-
48 m2 office space for rent in Copenhagen K, Copenhagen
- 17,000 DKK per month
- 4,250 DKK /m2/year
-
248 m2 office space for rent in Vedbæk, Greater Copenhagen
- 16,533 DKK per month
- 800 DKK /m2/year
-
188 m2 office space for rent in Hirtshals, North Jutland Region
- 7,833 DKK per month
- 500 DKK /m2/year
-
225 m2 office space for rent in Esbjerg, Esbjerg (region)
- 12,000 DKK per month
- 640 DKK /m2/year
-
37 m2 office space for rent in Capelle aan den IJssel, South Holland
- 800 EUR per month
- 259.46 EUR /m2/year
Frequently asked questions
Statistics on the development of available office spaces for rent over the past month
Also see aggregate statistics on all available office spaces over time, aggregate statistics on new office spaces over time, aggregate statistics on rented office spaces over time
| Date | |||
|---|---|---|---|
| 9. August 2025 | 123945 | 2790 | 2287 |
| 8. August 2025 | 123442 | 1915 | 1841 |
| 7. August 2025 | 123368 | 2768 | 1640 |
| 6. August 2025 | 122240 | 1342 | 1880 |
| 5. August 2025 | 122778 | 1610 | 2709 |
| 4. August 2025 | 123877 | 1575 | 0 |
| 3. August 2025 | 122302 | 2106 | 2794 |
| 2. August 2025 | 122990 | 1193 | 1404 |
| 1. August 2025 | 123201 | 3030 | 2803 |
| 31. July 2025 | 122974 | 1206 | 793 |
| 30. July 2025 | 122561 | 1950 | 2557 |
| 29. July 2025 | 123168 | 894 | 581 |
| 28. July 2025 | 122855 | 1803 | 1383 |
| 27. July 2025 | 122435 | 1492 | 2696 |
| 26. July 2025 | 123639 | 1932 | 1813 |
| 25. July 2025 | 123520 | 706 | 825 |
| 24. July 2025 | 123639 | 1670 | 1513 |
| 23. July 2025 | 123482 | 1075 | 513 |
| 22. July 2025 | 122920 | 2975 | 2235 |
| 21. July 2025 | 122180 | 1684 | 2443 |
| 20. July 2025 | 122939 | 1058 | 1106 |
| 19. July 2025 | 122987 | 1183 | 1181 |
| 18. July 2025 | 122985 | 2399 | 2521 |
| 17. July 2025 | 123107 | 619 | 655 |
| 16. July 2025 | 123143 | 2203 | 2591 |
| 15. July 2025 | 123531 | 1491 | 1525 |
| 14. July 2025 | 123565 | 515 | 855 |
| 13. July 2025 | 123905 | 1602 | 1176 |
| 12. July 2025 | 123479 | 1694 | 1484 |
| 11. July 2025 | 123269 | 2451 | 2896 |
| 10. July 2025 | 123714 | 1235 | 0 |
Statistics on currently available office spaces
Also see gathered statistics of all available office spaces over time, the gathered statistics of new office spaces over time, the gathered statistics of rented office spaces over time
| Office spaces | |
|---|---|
| Available premises | 123,885 |
| New premises since yesterday | 2,790 |
| Rented out premises since yesterday | 2,287 |
| Total available m2 | 2,932,469,031 |
| Average price per m2 per year without expenses | 29,085 |
| Highest price per m2 per year | 45,000,000 |
| Lowest price per m2 per year | 1 |


