Available office spaces in Belgium
See all available office spaces in Belgium below. If you are looking for office space in Belgium, you have come to the right place. We have almost all available office spaces in Belgium in our database. Find office space in Belgium here. Enjoy.
9,280 office spaces found
-
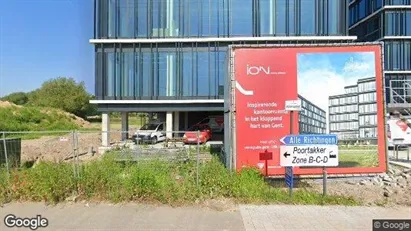
905 m2 office space for rent in Gent Sint-Denijs-Westrem, Gent
- 5,667 EUR per month
- 75.14 EUR /m2/year
-
80 m2 office space for rent in Gent Sint-Denijs-Westrem, Gent
- 1,400 EUR per month
- 210 EUR /m2/year
-
2345 m2 office space for rent in Mechelen, Antwerp (Province)
- 4,386 EUR per month
- 22.44 EUR /m2/year
-
240 m2 office space for rent in Stad Antwerp, Antwerp
- 1,850 EUR per month
- 92.50 EUR /m2/year
-
4416 m2 office space for rent in Stad Antwerp, Antwerp
- 3,543 EUR per month
- 9.63 EUR /m2/year
-
100 m2 office space for rent in Mechelen, Antwerp (Province)
- 1,950 EUR per month
- 234 EUR /m2/year
-
576 m2 office space for rent in Deinze, Oost-Vlaanderen
- 1,750 EUR per month
- 36.46 EUR /m2/year
-
1188 m2 office space for rent in Stad Gent, Gent
- 2,295 EUR per month
- 23.18 EUR /m2/year
-
1580 m2 office space for rent in Dilbeek, Vlaams-Brabant
- 3,313 EUR per month
- 25.16 EUR /m2/year
-
922 m2 office space for rent in Stad Antwerp, Antwerp
- 5,763 EUR per month
- 75.01 EUR /m2/year
-
5077 m2 office space for rent in Dilbeek, Vlaams-Brabant
- 6,042 EUR per month
- 14.28 EUR /m2/year
-
34 m2 office space for rent in Melle, Oost-Vlaanderen
- 895 EUR per month
- 315.88 EUR /m2/year
-
643 m2 office space for rent in Stad Gent, Gent
- 8,841 EUR per month
- 165 EUR /m2/year
-
100 m2 office space for rent in Nazareth, Oost-Vlaanderen
- 320 EUR per month
- 38.40 EUR /m2/year
-
455 m2 office space for rent in Antwerp Berchem, Antwerp
- 5,688 EUR per month
- 150.01 EUR /m2/year
-
508 m2 office space for rent in Stad Antwerp, Antwerp
- 1,891 EUR per month
- 44.67 EUR /m2/year
-
315 m2 office space for rent in Gent Mariakerke, Gent
- 2,338 EUR per month
- 89.07 EUR /m2/year
Frequently asked questions
Statistics on the development of available office spaces for rent in Belgium over the past month
Also see aggregate statistics on all available office spaces in Belgium over time, aggregate statistics on new office spaces in Belgium over time, aggregate statistics on rented office spaces in Belgium over time
| Date | |||
|---|---|---|---|
| 27. February 2025 | 9264 | 198 | 145 |
| 26. February 2025 | 9211 | 136 | 163 |
| 25. February 2025 | 9238 | 41 | 33 |
| 24. February 2025 | 9230 | 52 | 59 |
| 23. February 2025 | 9237 | 127 | 181 |
| 22. February 2025 | 9291 | 66 | 0 |
| 21. February 2025 | 9225 | 97 | 167 |
| 20. February 2025 | 9295 | 57 | 49 |
| 19. February 2025 | 9287 | 126 | 87 |
| 18. February 2025 | 9248 | 29 | 100 |
| 17. February 2025 | 9319 | 71 | 52 |
| 16. February 2025 | 9300 | 180 | 174 |
| 15. February 2025 | 9294 | 48 | 0 |
| 14. February 2025 | 9246 | 130 | 60 |
| 13. February 2025 | 9176 | 103 | 136 |
| 12. February 2025 | 9209 | 199 | 204 |
| 11. February 2025 | 9214 | 49 | 300 |
| 10. February 2025 | 9465 | 79 | 100 |
| 9. February 2025 | 9486 | 153 | 161 |
| 8. February 2025 | 9494 | 72 | 32 |
| 7. February 2025 | 9454 | 199 | 216 |
| 6. February 2025 | 9471 | 91 | 149 |
| 5. February 2025 | 9529 | 564 | 481 |
| 4. February 2025 | 9446 | 444 | 0 |
| 3. February 2025 | 9002 | 17 | 31 |
| 2. February 2025 | 9016 | 119 | 100 |
| 1. February 2025 | 8997 | 65 | 54 |
| 31. January 2025 | 8986 | 193 | 0 |
| 30. January 2025 | 8793 | 271 | 425 |
| 29. January 2025 | 8947 | 111 | 34 |
| 28. January 2025 | 8870 | 34 | 0 |
Statistics on currently available office spaces in Belgium
Also see gathered statistics of all available office spaces over time, the gathered statistics of new office spaces over time, the gathered statistics of rented office spaces over time
| Office spaces | |
|---|---|
| Available premises | 9,264 |
| New premises since yesterday | 198 |
| Rented out premises since yesterday | 145 |
| Total available m2 | 9,559,793 |
| Average price per m2 per year without expenses | 24,051 |
| Highest price per m2 per year | 2,938,656 |
| Lowest price per m2 per year | 1.18 |


