Available office spaces in Vlaams-Brabant
See all available office spaces in Vlaams-Brabant below. If you are looking for office space in Vlaams-Brabant, you have come to the right place. We have almost all available office spaces in Vlaams-Brabant in our database. Find office space in Vlaams-Brabant here. Enjoy.
1,575 office spaces found
-
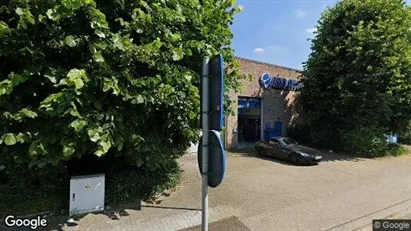
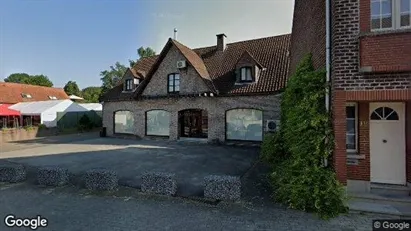
410 m2 office space for rent in Zaventem, Vlaams-Brabant
- 2,904 EUR per month
- 85 EUR /m2/year
-
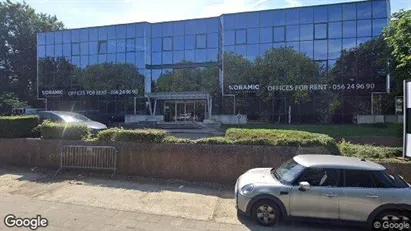
90 m2 office space for rent in Drogenbos, Vlaams-Brabant
- 1,300 EUR per month
- 173.33 EUR /m2/year
-
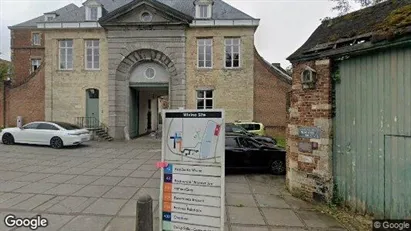
440 m2 office space for rent in Grimbergen, Vlaams-Brabant
- 4,767 EUR per month
- 130.01 EUR /m2/year
-
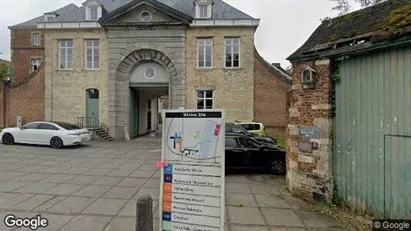
125 m2 office space for rent in Opwijk, Vlaams-Brabant
- 1,250 EUR per month
- 120 EUR /m2/year
-
88 m2 office space for rent in Affligem, Vlaams-Brabant
- 840 EUR per month
- 114.55 EUR /m2/year
-
90 m2 office space for rent in Sint-Pieters-Leeuw, Vlaams-Brabant
- 1,300 EUR per month
- 173.33 EUR /m2/year
-
782 m2 office space for rent in Machelen, Vlaams-Brabant
- 7,168 EUR per month
- 109.99 EUR /m2/year
-
473 m2 office space for rent in Grimbergen, Vlaams-Brabant
- 4,690 EUR per month
- 118.99 EUR /m2/year
-
115 m2 office space for rent in Ternat, Vlaams-Brabant
- 1,450 EUR per month
- 151.30 EUR /m2/year
-
207 m2 office space for rent in Zaventem, Vlaams-Brabant
- 2,156 EUR per month
- 124.99 EUR /m2/year
-
134 m2 office space for rent in Zaventem, Vlaams-Brabant
- 1,396 EUR per month
- 125.01 EUR /m2/year
-
164 m2 office space for rent in Londerzeel, Vlaams-Brabant
- 2,060 EUR per month
- 150.73 EUR /m2/year
-
632 m2 office space for rent in Wemmel, Vlaams-Brabant
- 6,057 EUR per month
- 115.01 EUR /m2/year
-
1077 m2 office space for rent in Wemmel, Vlaams-Brabant
- 10,322 EUR per month
- 115.01 EUR /m2/year
Frequently asked questions
Statistics on the development of available office spaces for rent in Vlaams-Brabant over the past month
Also see aggregate statistics on all available office spaces in Vlaams-Brabant over time, aggregate statistics on new office spaces in Vlaams-Brabant over time, aggregate statistics on rented office spaces in Vlaams-Brabant over time
| Date | |||
|---|---|---|---|
| 9. February 2025 | 1564 | 30 | 31 |
| 8. February 2025 | 1565 | 16 | 0 |
| 7. February 2025 | 1549 | 15 | 32 |
| 6. February 2025 | 1566 | 6 | 10 |
| 5. February 2025 | 1570 | 132 | 124 |
| 4. February 2025 | 1562 | 126 | 0 |
| 3. February 2025 | 1436 | 1 | 0 |
| 2. February 2025 | 1435 | 22 | 19 |
| 1. February 2025 | 1432 | 10 | 5 |
| 31. January 2025 | 1427 | 49 | 0 |
| 30. January 2025 | 1378 | 67 | 123 |
| 29. January 2025 | 1434 | 53 | 0 |
| 28. January 2025 | 1381 | 12 | 0 |
| 27. January 2025 | 1369 | 12 | 12 |
| 26. January 2025 | 1369 | 20 | 19 |
| 25. January 2025 | 1368 | 8 | 0 |
| 24. January 2025 | 1360 | 15 | 15 |
| 23. January 2025 | 1360 | 60 | 55 |
| 22. January 2025 | 1355 | 21 | 0 |
| 21. January 2025 | 1334 | 11 | 3 |
| 20. January 2025 | 1326 | 13 | 35 |
| 19. January 2025 | 1348 | 9 | 3 |
| 18. January 2025 | 1342 | 9 | 11 |
| 17. January 2025 | 1344 | 20 | 27 |
| 16. January 2025 | 1351 | 8 | 3 |
| 15. January 2025 | 1346 | 9 | 10 |
| 14. January 2025 | 1347 | 9 | 19 |
| 13. January 2025 | 1357 | 1 | 0 |
| 12. January 2025 | 1356 | 9 | 9 |
| 11. January 2025 | 1356 | 27 | 0 |
| 10. January 2025 | 1329 | 19 | 0 |
Statistics on currently available office spaces in Vlaams-Brabant in Belgium
Also see gathered statistics of all available office spaces in Vlaams-Brabant over time, the gathered statistics of new office spaces in Vlaams-Brabant over time, the gathered statistics of rented office spaces in Vlaams-Brabant over time
| Office spaces | |
|---|---|
| Available premises | 1,575 |
| New premises since yesterday | 30 |
| Rented out premises since yesterday | 31 |
| Total available m2 | 2,139,728 |
| Average price per m2 per year without expenses | 33,001 |
| Highest price per m2 per year | 1,500,000 |
| Lowest price per m2 per year | 1.69 |


