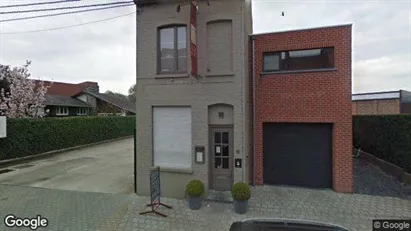
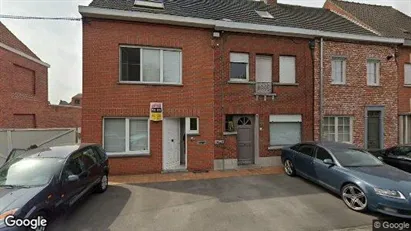
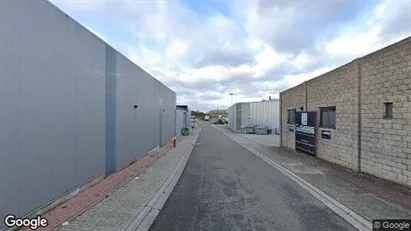
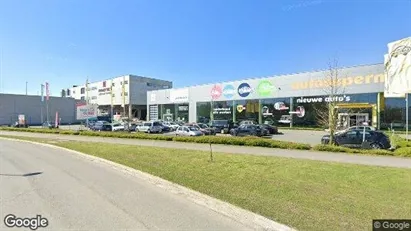
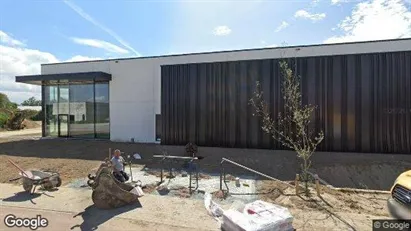
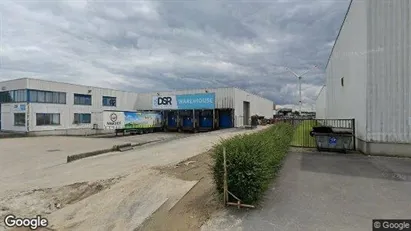
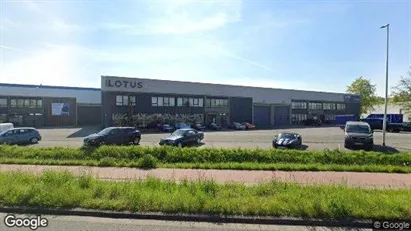
Available warehouses in Belgium
See all available warehouses in Belgium below. If you are looking for warehouse in Belgium, you have come to the right place. We have almost all available warehouses in Belgium in our database. Find warehouse in Belgium here. Enjoy.
1,369 warehouses found
-
25942 m2 warehouse for rent in Boom, Antwerp (Province)
- 65,757 EUR per month
- 30.42 EUR /m2/year
-
7528 m2 warehouse for rent in Herentals, Antwerp (Province)
- 35,062 EUR per month
- 55.89 EUR /m2/year
-
1211 m2 warehouse for rent in Antwerp Wilrijk, Antwerp
- 7,064 EUR per month
- 70 EUR /m2/year
-
264 m2 warehouse for rent in Eeklo, Oost-Vlaanderen
- 1,290 EUR per month
- 58.64 EUR /m2/year
-
995 m2 warehouse for rent in Herentals, Antwerp (Province)
- 807 EUR per month
- 9.73 EUR /m2/year
-
30000 m2 warehouse for rent in Gent Sint-Kruis-Winkel, Gent
- 54,167 EUR per month
- 21.67 EUR /m2/year
-
700 m2 warehouse for rent in Gent Sint-Denijs-Westrem, Gent
- 3,599 EUR per month
- 61.70 EUR /m2/year
-
2551 m2 warehouse for rent in Deinze, Oost-Vlaanderen
- 9,685 EUR per month
- 45.56 EUR /m2/year
-
970 m2 warehouse for rent in Lier, Antwerp (Province)
- 7,000 EUR per month
- 86.60 EUR /m2/year
-
2647 m2 warehouse for rent in Aalst, Oost-Vlaanderen
- 16,493 EUR per month
- 74.77 EUR /m2/year
-
2299 m2 warehouse for rent in Stad Antwerp, Antwerp
- 10,540 EUR per month
- 55.02 EUR /m2/year
-
835 m2 warehouse for rent in Evergem, Oost-Vlaanderen
- 1,100 EUR per month
- 15.81 EUR /m2/year
-
842 m2 warehouse for rent in Kontich, Antwerp (Province)
- 2,205 EUR per month
- 31.43 EUR /m2/year
-
3120 m2 warehouse for rent in Kapellen, Antwerp (Province)
- 1,825 EUR per month
- 7.02 EUR /m2/year
Frequently asked questions
Statistics on the development of available warehouses for rent in Belgium over the past month
Also see aggregate statistics on all available warehouses in Belgium over time, aggregate statistics on new warehouses in Belgium over time, aggregate statistics on rented warehouses in Belgium over time
| Date | |||
|---|---|---|---|
| 17. January 2025 | 1376 | 43 | 40 |
| 16. January 2025 | 1373 | 19 | 10 |
| 15. January 2025 | 1364 | 27 | 43 |
| 14. January 2025 | 1380 | 26 | 22 |
| 13. January 2025 | 1376 | 1 | 1 |
| 12. January 2025 | 1376 | 22 | 27 |
| 11. January 2025 | 1381 | 32 | 27 |
| 10. January 2025 | 1376 | 8 | 14 |
| 9. January 2025 | 1382 | 53 | 44 |
| 8. January 2025 | 1373 | 33 | 19 |
| 7. January 2025 | 1359 | 21 | 28 |
| 6. January 2025 | 1366 | 0 | 12 |
| 5. January 2025 | 1378 | 27 | 22 |
| 4. January 2025 | 1373 | 14 | 10 |
| 3. January 2025 | 1369 | 20 | 29 |
| 2. January 2025 | 1378 | 10 | 0 |
| 1. January 2025 | 1368 | 40 | 46 |
| 31. December 2024 | 1374 | 23 | 15 |
| 30. December 2024 | 1366 | 6 | 55 |
| 29. December 2024 | 1415 | 18 | 19 |
| 28. December 2024 | 1416 | 35 | 36 |
| 27. December 2024 | 1417 | 19 | 3 |
| 26. December 2024 | 1401 | 19 | 25 |
| 25. December 2024 | 1407 | 26 | 41 |
| 24. December 2024 | 1422 | 17 | 0 |
| 23. December 2024 | 1405 | 16 | 46 |
| 22. December 2024 | 1435 | 17 | 17 |
| 21. December 2024 | 1435 | 31 | 29 |
| 20. December 2024 | 1433 | 15 | 15 |
| 19. December 2024 | 1433 | 32 | 27 |
| 18. December 2024 | 1428 | 6 | 0 |
Statistics on currently available warehouses in Belgium
Also see gathered statistics of all available warehouses over time, the gathered statistics of new warehouses over time, the gathered statistics of rented warehouses over time
| Warehouses | |
|---|---|
| Available premises | 1,369 |
| New premises since yesterday | 43 |
| Rented out premises since yesterday | 40 |
| Total available m2 | 6,788,337 |
| Average price per m2 per year without expenses | 15,194 |
| Highest price per m2 per year | 798,336 |
| Lowest price per m2 per year | 5.25 |


