Commercial rentals in Antwerp (Province)
-
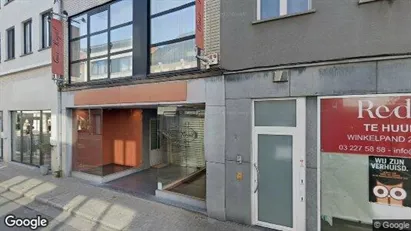
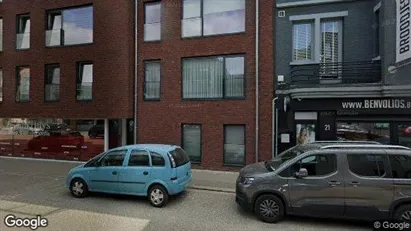
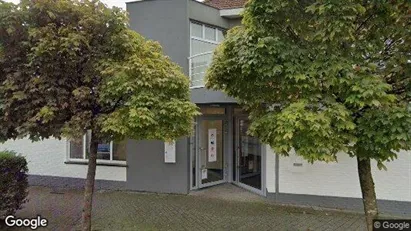
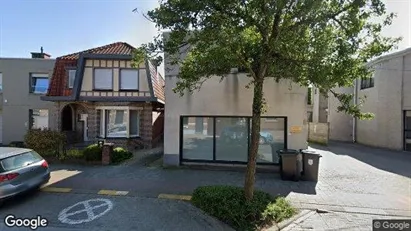
135 m2 commercial space for rent in Kontich, Antwerp (Province)
- 1,499 EUR per month
- 133.24 EUR /m2/year
-
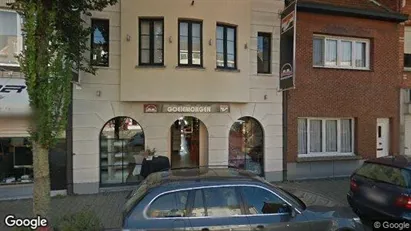
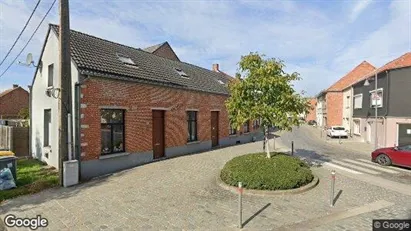
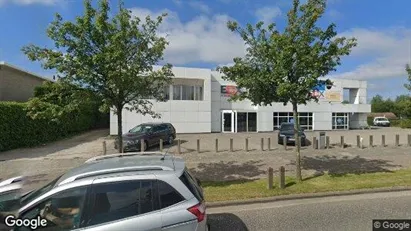
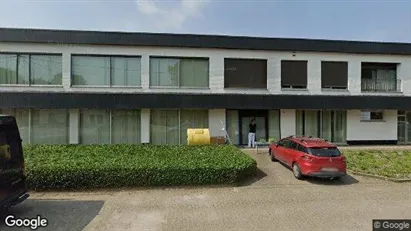
125 m2 commercial space for rent in Schoten, Antwerp (Province)
- 1,250 EUR per month
- 120 EUR /m2/year
-
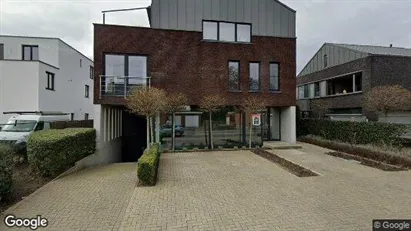
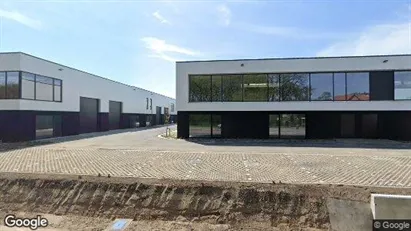
116 m2 commercial space for rent in Ranst, Antwerp (Province)
- 975 EUR per month
- 100.86 EUR /m2/year
-
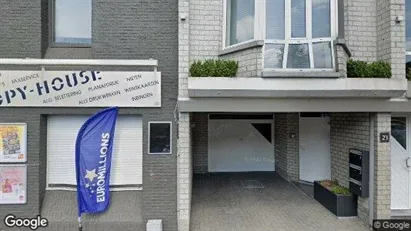
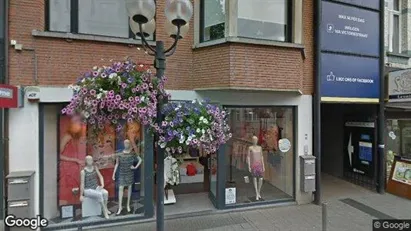
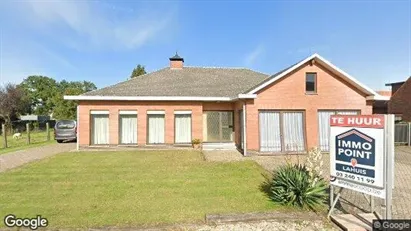
120 m2 commercial space for rent in Zandhoven, Antwerp (Province)
- 1,750 EUR per month
- 175 EUR /m2/year
-
122 m2 commercial space for rent in Herentals, Antwerp (Province)
- 900 EUR per month
- 88.52 EUR /m2/year
-
768 m2 office space for rent in Antwerp Berchem, Antwerp
- 9,600 EUR per month
- 150 EUR /m2/year
-
107 m2 commercial space for rent in Turnhout, Antwerp (Province)
- 2,100 EUR per month
- 235.51 EUR /m2/year
-
125 m2 office space for rent in Kasterlee, Antwerp (Province)
- 1,650 EUR per month
- 158.40 EUR /m2/year
-
169 m2 commercial space for rent in Rumst, Antwerp (Province)
- 1,838 EUR per month
- 130.51 EUR /m2/year
-
300 m2 office space for rent in Wuustwezel, Antwerp (Province)
- 1,400 EUR per month
- 56 EUR /m2/year
-
118 m2 warehouse for rent in Kalmthout, Antwerp (Province)
- 1,100 EUR per month
- 111.86 EUR /m2/year
-
350 m2 office space for rent in Herentals, Antwerp (Province)
- 1,985 EUR per month
- 68.06 EUR /m2/year
-
227 m2 commercial space for rent in Kasterlee, Antwerp (Province)
- 1,460 EUR per month
- 77.18 EUR /m2/year
-
605 m2 commercial space for rent in Herentals, Antwerp (Province)
- 4,000 EUR per month
- 79.34 EUR /m2/year
-
188 m2 commercial space for rent in Kasterlee, Antwerp (Province)
- 1,285 EUR per month
- 82.02 EUR /m2/year
Frequently asked questions
Statistics on the development of available commercial real estate for rent in Antwerp (Province) over the past month
Below you can see the development of available commercial real estate for rent in Antwerp (Province) over the past month. In the first column you see the date. In the second column you see the total amount of commercial real estate for rent in Antwerp (Province) on the date. In the third column you see the amount of new commercial real estate in Antwerp (Province) that was available for rent on the date. In the fourth column you see the amount of commercial real estate in Antwerp (Province) that was rented on the date. Also see aggregate statistics on all available commercial rentals in Antwerp (Province) over time, aggregate statistics on new commercial rentals in Antwerp (Province) over time, aggregate statistics on rented commercial real estate in Antwerp (Province) over time
| Date | All commercial real estate for rent | New commercial real estate for rent | Rented out commercial real estate |
|---|---|---|---|
| 2. February 2025 | 3045 | 65 | 66 |
| 1. February 2025 | 3046 | 26 | 12 |
| 31. January 2025 | 3032 | 51 | 12 |
| 30. January 2025 | 2993 | 83 | 149 |
| 29. January 2025 | 3059 | 46 | 35 |
| 28. January 2025 | 3048 | 16 | 29 |
| 27. January 2025 | 3061 | 29 | 30 |
| 26. January 2025 | 3062 | 62 | 43 |
| 25. January 2025 | 3043 | 31 | 6 |
| 24. January 2025 | 3018 | 55 | 70 |
| 23. January 2025 | 3033 | 56 | 55 |
| 22. January 2025 | 3032 | 25 | 43 |
| 21. January 2025 | 3050 | 51 | 37 |
| 20. January 2025 | 3036 | 37 | 39 |
| 19. January 2025 | 3038 | 37 | 7 |
| 18. January 2025 | 3008 | 50 | 55 |
| 17. January 2025 | 3013 | 61 | 93 |
| 16. January 2025 | 3045 | 41 | 41 |
| 15. January 2025 | 3045 | 78 | 78 |
| 14. January 2025 | 3045 | 55 | 36 |
| 13. January 2025 | 3026 | 8 | 13 |
| 12. January 2025 | 3031 | 21 | 35 |
| 11. January 2025 | 3045 | 68 | 27 |
| 10. January 2025 | 3004 | 22 | 39 |
| 9. January 2025 | 3021 | 48 | 47 |
| 8. January 2025 | 3020 | 35 | 13 |
| 7. January 2025 | 2998 | 83 | 117 |
| 6. January 2025 | 3032 | 42 | 14 |
| 5. January 2025 | 3004 | 31 | 6 |
| 4. January 2025 | 2979 | 35 | 32 |
| 3. January 2025 | 2976 | 49 | 0 |
Statistics on currently available commercial spaces for rent in Antwerp (Province) in Belgium
In the table below, you see a series of data about available commercial space to rent in Antwerp (Province).Also see gathered statistics of all available commercial space in Antwerp (Province) over time, the gathered statistics of new commercial space in Antwerp (Province) over time, the gathered statistics of rented commercial space in Antwerp (Province) over time
| Total | |
|---|---|
| Available premises | 2,920 |
| New premises since yesterday | 65 |
| Rented out premises since yesterday | 66 |
| Total available m2 | 3,046,891 |
| Average price per m2 per year without expenses | 6,471 |
| Highest price per m2 per year | 1,017,720 |
| Lowest price per m2 per year | 1.59 |


