Commercial rentals in Oost-Vlaanderen
-
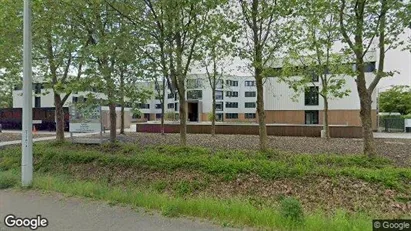
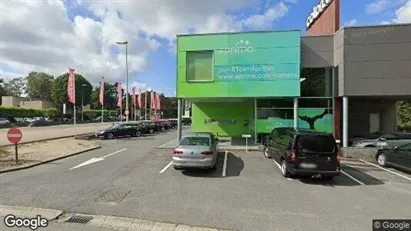
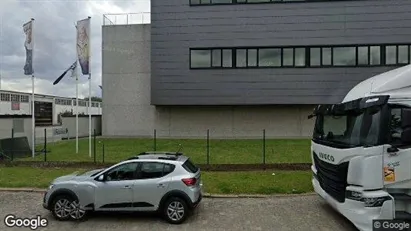
2946 m2 office space for rent in Gent Zwijnaarde, Gent
- 1,330 EUR per month
- 5.42 EUR /m2/year
-
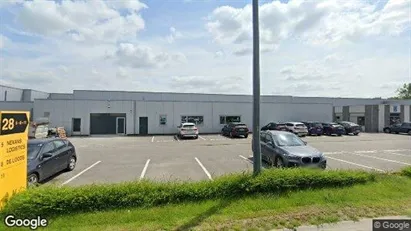
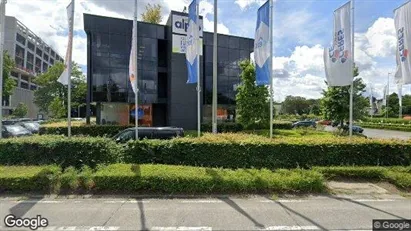
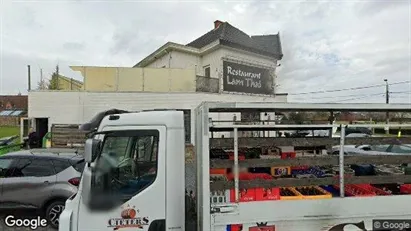
2647 m2 warehouse for rent in Aalst, Oost-Vlaanderen
- 16,493 EUR per month
- 74.77 EUR /m2/year
-
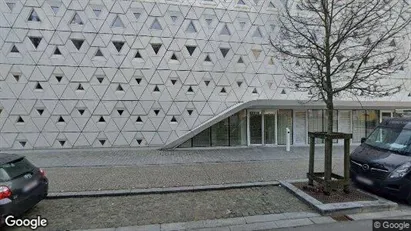
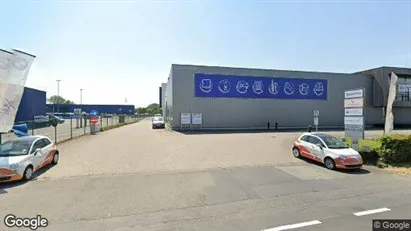
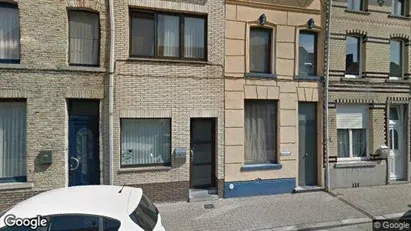
2714 m2 office space for rent in Stad Gent, Gent
- 40,710 EUR per month
- 180 EUR /m2/year
-
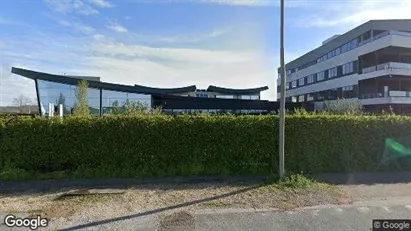
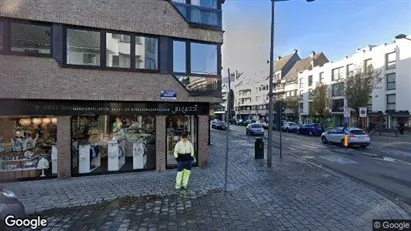
320 m2 office space for rent in Gent Sint-Kruis-Winkel, Gent
- 2,700 EUR per month
- 101.25 EUR /m2/year
-
650 m2 office space for rent in Gent Sint-Denijs-Westrem, Gent
- 7,500 EUR per month
- 138.46 EUR /m2/year
-
492 m2 office space for rent in Gent Sint-Denijs-Westrem, Gent
- 5,494 EUR per month
- 134 EUR /m2/year
-
363 m2 office space for rent in Aalter, Oost-Vlaanderen
- 3,328 EUR per month
- 110.02 EUR /m2/year
-
926 m2 office space for rent in Sint-Niklaas, Oost-Vlaanderen
- 3,280 EUR per month
- 42.51 EUR /m2/year
-
782 m2 office space for rent in Stad Gent, Gent
- 4,000 EUR per month
- 61.38 EUR /m2/year
-
48 m2 office space for rent in Melle, Oost-Vlaanderen
- 1,600 EUR per month
- 400 EUR /m2/year
-
215 m2 commercial space for rent in Ninove, Oost-Vlaanderen
- 3,180 EUR per month
- 177.49 EUR /m2/year
-
215 m2 office space for rent in Ninove, Oost-Vlaanderen
- 3,180 EUR per month
- 177.49 EUR /m2/year
-
120 m2 office space for rent in Ninove, Oost-Vlaanderen
- 1,300 EUR per month
- 130 EUR /m2/year
-
120 m2 commercial space for rent in Ninove, Oost-Vlaanderen
- 1,300 EUR per month
- 130 EUR /m2/year
-
91 m2 commercial space for rent in Stad Gent, Gent
- 125 EUR per month
- 16.48 EUR /m2/year
-
1090 m2 office space for rent in Beveren, Oost-Vlaanderen
- 11,808 EUR per month
- 130 EUR /m2/year
Frequently asked questions
Statistics on the development of available commercial real estate for rent in Oost-Vlaanderen over the past month
Below you can see the development of available commercial real estate for rent in Oost-Vlaanderen over the past month. In the first column you see the date. In the second column you see the total amount of commercial real estate for rent in Oost-Vlaanderen on the date. In the third column you see the amount of new commercial real estate in Oost-Vlaanderen that was available for rent on the date. In the fourth column you see the amount of commercial real estate in Oost-Vlaanderen that was rented on the date. Also see aggregate statistics on all available commercial rentals in Oost-Vlaanderen over time, aggregate statistics on new commercial rentals in Oost-Vlaanderen over time, aggregate statistics on rented commercial real estate in Oost-Vlaanderen over time
| Date | All commercial real estate for rent | New commercial real estate for rent | Rented out commercial real estate |
|---|---|---|---|
| 1. April 2025 | 1641 | 8 | 19 |
| 31. March 2025 | 1652 | 1 | 6 |
| 30. March 2025 | 1657 | 59 | 56 |
| 29. March 2025 | 1654 | 31 | 7 |
| 28. March 2025 | 1630 | 14 | 21 |
| 27. March 2025 | 1637 | 36 | 36 |
| 26. March 2025 | 1637 | 24 | 24 |
| 25. March 2025 | 1637 | 9 | 8 |
| 24. March 2025 | 1636 | 12 | 4 |
| 23. March 2025 | 1628 | 36 | 42 |
| 22. March 2025 | 1634 | 20 | 16 |
| 21. March 2025 | 1630 | 26 | 32 |
| 20. March 2025 | 1636 | 24 | 24 |
| 19. March 2025 | 1636 | 47 | 57 |
| 18. March 2025 | 1646 | 17 | 8 |
| 17. March 2025 | 1637 | 28 | 67 |
| 16. March 2025 | 1676 | 21 | 44 |
| 15. March 2025 | 1699 | 18 | 0 |
| 14. March 2025 | 1681 | 45 | 43 |
| 13. March 2025 | 1679 | 20 | 12 |
| 12. March 2025 | 1671 | 25 | 29 |
| 11. March 2025 | 1675 | 10 | 19 |
| 10. March 2025 | 1684 | 32 | 36 |
| 9. March 2025 | 1688 | 21 | 10 |
| 8. March 2025 | 1677 | 0 | 0 |
| 7. March 2025 | 1677 | 32 | 21 |
| 6. March 2025 | 1666 | 30 | 20 |
| 5. March 2025 | 1656 | 10 | 13 |
| 4. March 2025 | 1659 | 7 | 5 |
| 3. March 2025 | 1657 | 24 | 31 |
| 2. March 2025 | 1664 | 5 | 0 |
Statistics on currently available commercial spaces for rent in Oost-Vlaanderen in Belgium
In the table below, you see a series of data about available commercial space to rent in Oost-Vlaanderen.Also see gathered statistics of all available commercial space in Oost-Vlaanderen over time, the gathered statistics of new commercial space in Oost-Vlaanderen over time, the gathered statistics of rented commercial space in Oost-Vlaanderen over time
| Total | |
|---|---|
| Available premises | 1,601 |
| New premises since yesterday | 8 |
| Rented out premises since yesterday | 19 |
| Total available m2 | 2,237,948 |
| Average price per m2 per year without expenses | 7,388 |
| Highest price per m2 per year | 516,000 |
| Lowest price per m2 per year | 1.2 |


