Commercial property for rent in West-Vlaanderen
-
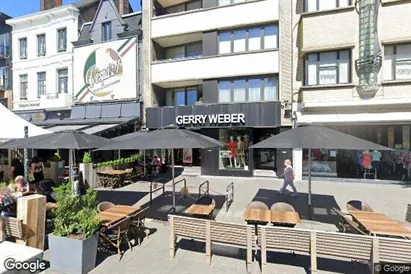
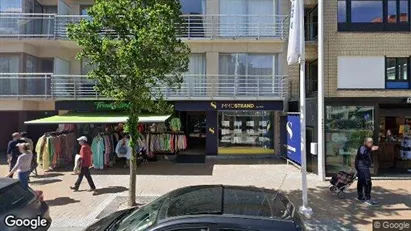
120 m2 commercial space for rent in Veurne, West-Vlaanderen
- 990 EUR per month
- 99 EUR /m2/year
-
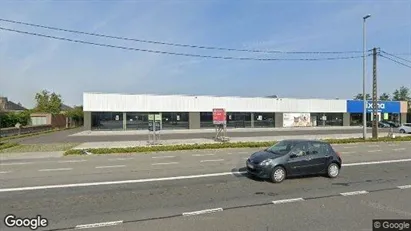
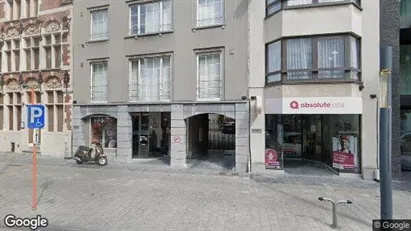
400 m2 commercial space for rent in Roeselare, West-Vlaanderen
- 8,000 EUR per month
- 240 EUR /m2/year
-
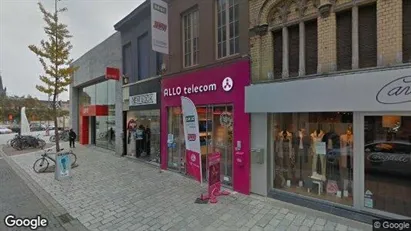
513 m2 commercial space for rent in Veurne, West-Vlaanderen
- 2,750 EUR per month
- 64.33 EUR /m2/year
-
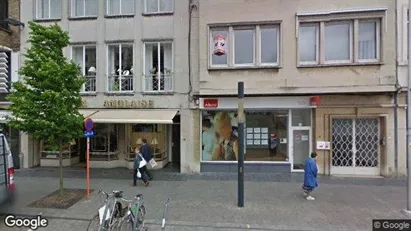
112 m2 commercial space for rent in Ieper, West-Vlaanderen
- 1,000 EUR per month
- 107.14 EUR /m2/year
-
738 m2 commercial space for rent in Roeselare, West-Vlaanderen
- 3,998 EUR per month
- 65.01 EUR /m2/year
-
1310 m2 commercial space for rent in Veurne, West-Vlaanderen
- 13,100 EUR per month
- 120 EUR /m2/year
-
420 m2 commercial space for rent in Roeselare, West-Vlaanderen
- 7,917 EUR per month
- 226.20 EUR /m2/year
-
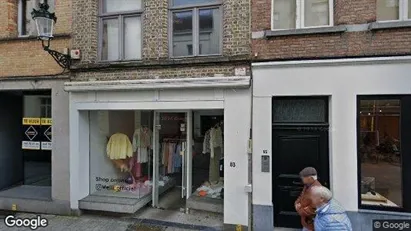
66 m2 commercial space for rent in Brugge, West-Vlaanderen
- 1,900 EUR per month
- 345.45 EUR /m2/year
-
473 m2 commercial space for rent in Waregem, West-Vlaanderen
- 4,335 EUR per month
- 109.98 EUR /m2/year
-
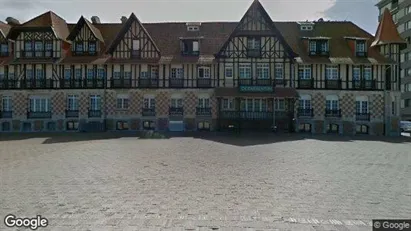
134 m2 commercial space for rent in Nieuwpoort, West-Vlaanderen
- 3,500 EUR per month
- 313.43 EUR /m2/year
-
74 m2 commercial space for rent in Nieuwpoort, West-Vlaanderen
- 2,700 EUR per month
- 437.84 EUR /m2/year
-
54 m2 commercial space for rent in Kortrijk, West-Vlaanderen
- 850 EUR per month
- 188.89 EUR /m2/year
-
150 m2 commercial space for rent in Roeselare, West-Vlaanderen
- 2,500 EUR per month
- 200 EUR /m2/year
-
280 m2 commercial space for rent in Kortrijk, West-Vlaanderen
- 2,495 EUR per month
- 106.93 EUR /m2/year
-
535 m2 commercial space for rent in Kuurne, West-Vlaanderen
- 3,950 EUR per month
- 88.60 EUR /m2/year
-
498 m2 commercial space for rent in Veurne, West-Vlaanderen
- 4,980 EUR per month
- 120 EUR /m2/year
-
461 m2 commercial space for rent in Veurne, West-Vlaanderen
- 4,225 EUR per month
- 109.98 EUR /m2/year
-
343 m2 commercial space for rent in Veurne, West-Vlaanderen
- 3,430 EUR per month
- 120 EUR /m2/year
Frequently asked questions
Statistics on the development of available commercial properties for rent in West-Vlaanderen over the past month
Below you can see the development of available commercial properties for rent in West-Vlaanderen over the past month. In the first column you see the date. In the second column you see the total amount of commercial properties for rent in West-Vlaanderen on the date. In the third column you see the amount of new commercial properties in West-Vlaanderen that was available for rent on the date. In the fourth column you see the amount of commercial properties in West-Vlaanderen that was rented on the date. Also see aggregate statistics on all available commercial properties in West-Vlaanderen over time, aggregate statistics on new commercial properties in West-Vlaanderen over time, aggregate statistics on rented commercial properties in West-Vlaanderen over time
| Date | All commercial properties for rent | New commercial properties for rent | Rented out commercial properties |
|---|---|---|---|
| 11. February 2025 | 300 | 2 | 0 |
| 10. February 2025 | 298 | 1 | 1 |
| 9. February 2025 | 298 | 2 | 3 |
| 8. February 2025 | 299 | 2 | 1 |
| 7. February 2025 | 298 | 3 | 0 |
| 6. February 2025 | 295 | 14 | 14 |
| 5. February 2025 | 295 | 14 | 0 |
| 4. February 2025 | 281 | 1 | 0 |
| 3. February 2025 | 280 | 0 | 0 |
| 2. February 2025 | 280 | 3 | 5 |
| 1. February 2025 | 282 | 0 | 6 |
| 31. January 2025 | 288 | 1 | 2 |
| 30. January 2025 | 289 | 2 | 3 |
| 29. January 2025 | 290 | 5 | 6 |
| 28. January 2025 | 291 | 1 | 0 |
| 27. January 2025 | 290 | 1 | 0 |
| 26. January 2025 | 289 | 1 | 2 |
| 25. January 2025 | 290 | 1 | 2 |
| 24. January 2025 | 291 | 4 | 1 |
| 23. January 2025 | 288 | 5 | 12 |
| 22. January 2025 | 295 | 0 | 8 |
| 21. January 2025 | 303 | 3 | 4 |
| 20. January 2025 | 304 | 3 | 0 |
| 19. January 2025 | 301 | 0 | 0 |
| 18. January 2025 | 301 | 3 | 3 |
| 17. January 2025 | 301 | 3 | 0 |
| 16. January 2025 | 298 | 3 | 1 |
| 15. January 2025 | 296 | 4 | 4 |
| 14. January 2025 | 296 | 1 | 0 |
| 13. January 2025 | 295 | 1 | 0 |
| 12. January 2025 | 294 | 0 | 0 |
Statistics on currently available commercial properties for rent in West-Vlaanderen in Belgium
In the table below, you see a series of data about available commercial properties to rent in West-Vlaanderen.Also see gathered statistics of all available commercial properties in West-Vlaanderen over time, the gathered statistics of new commercial properties in West-Vlaanderen over time, the gathered statistics of rented commercial properties in West-Vlaanderen over time
| Commercial properties | |
|---|---|
| Available premises | 300 |
| New premises since yesterday | 2 |
| Rented out premises since yesterday | 0 |
| Total available m2 | 125,882 |
| Average price per m2 per year without expenses | 187 |
| Highest price per m2 per year | 1,300 |
| Lowest price per m2 per year | 1.36 |


