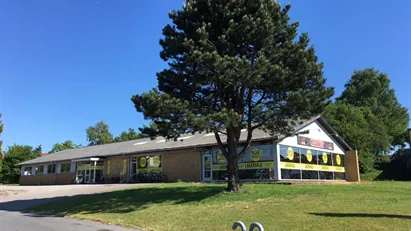
Available industrial properties in Denmark
See all available industrial properties in Denmark below. If you are looking for industrial property in Denmark, you have come to the right place. We have almost all available industrial properties in Denmark in our database. Find industrial property in Denmark here. Enjoy.
1,255 industrial properties found
-
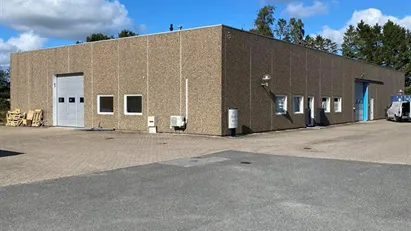
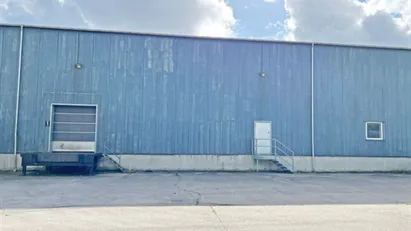
500 m2 warehouse for rent in Ullerslev, Funen
- 12,292 DKK per month
- 295 DKK /m2/year
-
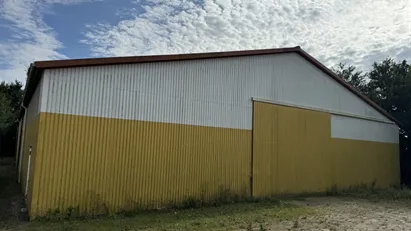
2000 m2 warehouse for rent in Ullerslev, Funen
- 49,167 DKK per month
- 295 DKK /m2/year
-
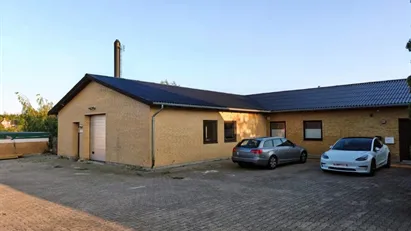
250 m2 warehouse for rent in Ejby, Funen
- 5,208 DKK per month
- 250 DKK /m2/year
-
550 m2 warehouse for rent in Nyborg, Funen
- 13,000 DKK per month
- 283 DKK /m2/year
-
2024 m2 industrial property for rent in Viborg, Central Jutland Region
- 50,600 DKK per month
- 300 DKK /m2/year
-
297 m2 industrial property for rent in Herlufmagle, Region Zealand
- 27,500 DKK per month
- 1,111 DKK /m2/year
-
1643 m2 industrial property for rent in Viborg, Central Jutland Region
- 41,075 DKK per month
- 300 DKK /m2/year
-
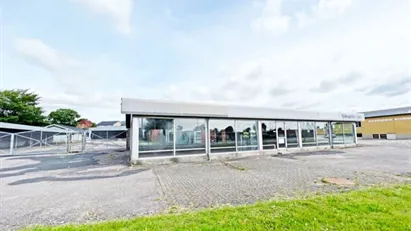
1530 m2 showroom for rent in Bjerringbro, Central Jutland Region
- 29,500 DKK per month
- 231 DKK /m2/year
-
87 m2 warehouse for rent in Viby Sjælland, Region Zealand
- 5,542 DKK per month
- 764 DKK /m2/year
-
1997 m2 industrial property for rent in Viborg, Central Jutland Region
- 53,675 DKK per month
- 322 DKK /m2/year
-
2684 m2 industrial property for rent in Brande, Region of Southern Denmark
- 67,100 DKK per month
- 300 DKK /m2/year
-
1000 m2 warehouse for rent in Søndersø, Funen
- 10,000 DKK per month
- 120 DKK /m2/year
-
375 m2 industrial property for rent in Stenløse, North Zealand
- 20,456 DKK per month
- 654 DKK /m2/year
-
605 m2 industrial property for rent in Nyborg, Funen
- 32,940 DKK per month
- 653 DKK /m2/year
Frequently asked questions
Statistics on the development of available industrial properties for rent in Denmark over the past month
Also see aggregate statistics on all available industrial properties in Denmark over time, aggregate statistics on new industrial properties in Denmark over time, aggregate statistics on rented industrial properties in Denmark over time
| Date | |||
|---|---|---|---|
| 1. April 2025 | 1246 | 10 | 9 |
| 31. March 2025 | 1245 | 10 | 15 |
| 30. March 2025 | 1250 | 10 | 0 |
| 29. March 2025 | 1240 | 14 | 19 |
| 28. March 2025 | 1245 | 12 | 14 |
| 27. March 2025 | 1247 | 13 | 10 |
| 26. March 2025 | 1244 | 14 | 6 |
| 25. March 2025 | 1236 | 34 | 33 |
| 24. March 2025 | 1235 | 12 | 0 |
| 23. March 2025 | 1223 | 7 | 0 |
| 22. March 2025 | 1216 | 13 | 14 |
| 21. March 2025 | 1217 | 28 | 19 |
| 20. March 2025 | 1208 | 8 | 0 |
| 19. March 2025 | 1200 | 4 | 0 |
| 18. March 2025 | 1196 | 2 | 0 |
| 17. March 2025 | 1194 | 0 | 3 |
| 16. March 2025 | 1197 | 10 | 0 |
| 15. March 2025 | 1187 | 8 | 16 |
| 14. March 2025 | 1195 | 19 | 0 |
| 13. March 2025 | 1176 | 3 | 12 |
| 12. March 2025 | 1185 | 14 | 0 |
| 11. March 2025 | 1171 | 2 | 14 |
| 10. March 2025 | 1183 | 0 | 2 |
| 9. March 2025 | 1185 | 5 | 7 |
| 8. March 2025 | 1187 | 0 | 0 |
| 7. March 2025 | 1187 | 15 | 13 |
| 6. March 2025 | 1185 | 1 | 3 |
| 5. March 2025 | 1187 | 16 | 17 |
| 4. March 2025 | 1188 | 4 | 0 |
| 3. March 2025 | 1184 | 2 | 7 |
| 2. March 2025 | 1189 | 1 | 0 |
Statistics on currently available industrial properties in Denmark
Also see gathered statistics of all available industrial properties over time, the gathered statistics of new industrial properties over time, the gathered statistics of rented industrial properties over time
| Industrial properties | |
|---|---|
| Available premises | 1,255 |
| New premises since yesterday | 10 |
| Rented out premises since yesterday | 9 |
| Total available m2 | 2,413,500 |
| Average price per m2 per year without expenses | 913 |
| Highest price per m2 per year | 83,682 |
| Lowest price per m2 per year | 13 |


