Available industrial properties in Denmark
Frequently asked questions
Useful to know when you are searching for available industrial properties in Denmark
In the happiest country in the world (2016) and the mother of beer, bacon and the phenomenon of ‘Hygge’, not a single day is dull. Denmark is the smallest country of Scandinavia and located in between Germany and Sweden on a sum of small islands. It’s home to around 5,800,000 citizens. However if you look beyond the country at the Kingdom Of Denmark, which also includes the Faroe Islands and Greenland, the population grows to 5,9 million. The capital and most populous city is called Copenhagen and is located on the island of Zealand. In this centre of culture, architecture, art, music and gastronomy all within walking distance, you’ll have no difficulty filling out the spare time. Go for a pastry in one of the many small bakeries with the rest of the Danes on their way to work, stroll through the aesthetic narrow streets, grab a bite at a restaurant, and end up at a bar grabbing a good old Carlsberg beer with your buddies. There are additionally many museums and galleries, and the gastronomical scene in Denmark is also greatly saluted, most recently as Noma and Geranium were rated the two best restaurants in the world by The Worlds’ 50 Best Restaurants.
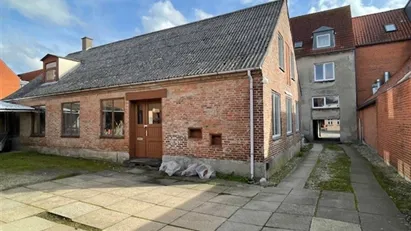
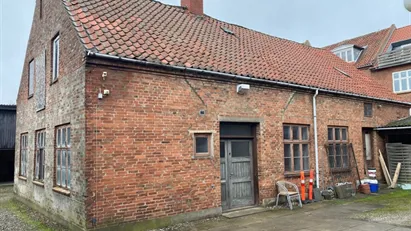
Denmark has a rich history dating all the way back to around 120,000 BC and therefore has many stories to tell. In many cities you’ll find charming old farm houses from the 17th century peacefully located in between modern architecture from every decade following. This image is very expository of the energy Denmark oozes, and perhaps some sort of illustration of what hygge feels like. The fairytale-like scenery is compliant with Denmark’s contribution to the world throughout the past. The infamous fairytale writer H. C Anderson was born in Denmark in 1805, and managed to write some of the most recognized fairytales, such as The Emperor's New Clothes, The Little Mermaid, The Nightingale, The Steadfast Tin Soldier, The Snow Queen and many more. Millions of people visit Denmark to experience a piece of these fairytales. Beyond the cities, castles of all sizes, small homesteads and lakes bedeck the rolling hills full of fields of different agriculture in different colors. The castles are especially a common point on the itinerary of tourists and expats, and we get why. A number of castles in Denmark are kept intact and restored regularly to keep the history of the country alive. At Kronborg castle for instance, you’re invited into an experience of royal life in 1843. The state of Denmark is currently a form of constitutional monarchy, which means they have an actual queen, Margrethe the II, Queen of Denmark.
Despite the strong ties to their mature past of Vikings, royalty and trading, Denmark is known to be very progressive in many fields. In 1969, they were the first country in the world to legalize pornography, it was the first in the world to introduce same-sex-marriage laws in 1989, and its currently one of the leading countries in sustainable energy, as The wind production per capita exceeds that of any other OECD country.
It’s a popular country among many expats as the welfare system is very beneficial and provides anyone with residency a right for free healthcare, free education, 52 weeks leave with maternity subsistence allowance, an allowance as student and many more. They are able to achieve this through taxes. The labour market is rather unproblematic to enter as a foreigner as English is a common language in offices, and there’s a high number of international companies.


