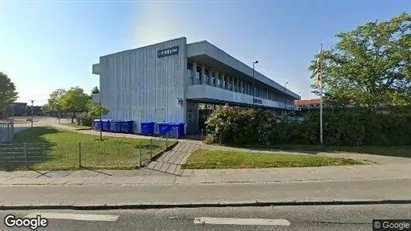
Available office spaces in Højbjerg
See all available office spaces in Højbjerg below. If you are looking for office space in Højbjerg, you have come to the right place. We have most available office spaces in Højbjerg in our database. Find office space in Højbjerg here. Enjoy.
29 office spaces found
-
150 m2 office space for rent in Højbjerg, Aarhus
- 10,000 DKK per month
- 800 DKK /m2/year
-
1 m2 office space for rent in Højbjerg, Aarhus
- 70,833 DKK per month
- 850 DKK /m2/year
-
4 m2 office space for rent in Højbjerg, Aarhus
- 283,333 DKK per month
- 850 DKK /m2/year
-
10 m2 office space for rent in Højbjerg, Aarhus
- 621,888 DKK per month
- 745 DKK /m2/year
-
366 m2 office space for rent in Højbjerg, Aarhus
- 30,500 DKK per month
- 1,000 DKK /m2/year
-
732 m2 office space for rent in Højbjerg, Aarhus
- 59,475 DKK per month
- 975 DKK /m2/year
-
386 m2 warehouse for rent in Højbjerg, Aarhus
- 23,446 DKK per month
- 728 DKK /m2/year
-
676 m2 warehouse for rent in Højbjerg, Aarhus
- 25,350 DKK per month
- 450 DKK /m2/year
-
221 m2 office space for rent in Højbjerg, Aarhus
- 12,708 DKK per month
- 690 DKK /m2/year
-
173 m2 office space for rent in Højbjerg, Aarhus
- 10,833 DKK per month
- 751 DKK /m2/year
-
1098 m2 office space for rent in Højbjerg, Aarhus
- 89,975 DKK per month
- 983 DKK /m2/year
-
199 m2 office space for rent in Højbjerg, Aarhus
- 14,096 DKK per month
- 850 DKK /m2/year
-
835 m2 office space for rent in Højbjerg, Aarhus
- 59,146 DKK per month
- 850 DKK /m2/year
-
267 m2 office space for rent in Højbjerg, Aarhus
- 18,912 DKK per month
- 850 DKK /m2/year
-
568 m2 office space for rent in Højbjerg, Aarhus
- 40,233 DKK per month
- 850 DKK /m2/year
-
369 m2 office space for rent in Højbjerg, Aarhus
- 26,138 DKK per month
- 850 DKK /m2/year
-
2232 m2 office space for rent in Højbjerg, Aarhus
- 65,844 DKK per month
- 354 DKK /m2/year
Statistics on the development of available office spaces for rent in Højbjerg over the past month
Also see aggregate statistics on all available office spaces in Højbjerg over time, aggregate statistics on new office spaces in Højbjerg over time, aggregate statistics on rented office spaces in Højbjerg over time
| Date | |||
|---|---|---|---|
| 11. August 2025 | 29 | 0 | 0 |
| 10. August 2025 | 29 | 0 | 0 |
| 9. August 2025 | 29 | 0 | 0 |
| 8. August 2025 | 29 | 0 | 0 |
| 7. August 2025 | 29 | 0 | 0 |
| 6. August 2025 | 29 | 0 | 0 |
| 5. August 2025 | 29 | 0 | 0 |
| 4. August 2025 | 29 | 0 | 0 |
| 3. August 2025 | 29 | 0 | 0 |
| 2. August 2025 | 29 | 3 | 3 |
| 1. August 2025 | 29 | 3 | 0 |
| 31. July 2025 | 26 | 0 | 0 |
| 30. July 2025 | 26 | 0 | 0 |
| 29. July 2025 | 26 | 0 | 0 |
| 28. July 2025 | 26 | 0 | 0 |
| 27. July 2025 | 26 | 0 | 0 |
| 26. July 2025 | 26 | 0 | 0 |
| 25. July 2025 | 26 | 3 | 5 |
| 24. July 2025 | 28 | 3 | 3 |
| 23. July 2025 | 28 | 3 | 0 |
| 22. July 2025 | 25 | 0 | 1 |
| 21. July 2025 | 26 | 0 | 0 |
| 20. July 2025 | 26 | 1 | 0 |
| 19. July 2025 | 25 | 0 | 0 |
| 18. July 2025 | 25 | 0 | 0 |
| 17. July 2025 | 25 | 0 | 1 |
| 16. July 2025 | 26 | 1 | 0 |
| 15. July 2025 | 25 | 0 | 0 |
| 14. July 2025 | 25 | 0 | 0 |
| 13. July 2025 | 25 | 0 | 0 |
| 12. July 2025 | 25 | 0 | 0 |
Statistics on currently available office spaces in Højbjerg in Denmark
Also see gathered statistics of all available office spaces in Højbjerg over time, the gathered statistics of new office spaces in Højbjerg over time, the gathered statistics of rented office spaces in Højbjerg over time
| Office spaces | |
|---|---|
| Available premises | 29 |
| New premises since yesterday | 0 |
| Rented out premises since yesterday | 0 |
| Total available m2 | 28,457 |
| Average price per m2 per year without expenses | 103 |
| Highest price per m2 per year | 134 |
| Lowest price per m2 per year | 47 |


