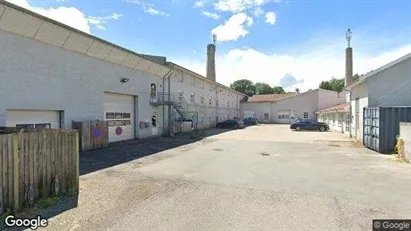
Commercial rentals in North Zealand
-
28 m2 office space for rent in Virum, Greater Copenhagen
- 4,445 DKK per month
- 1,905 DKK /m2/year
-
760 m2 industrial property for rent in Farum, North Zealand
- 49,011 DKK per month
- 773 DKK /m2/year
-
42 m2 office space for rent in Hillerød, North Zealand
- 4,000 DKK per month
- 1,142 DKK /m2/year
-
110 m2 office space for rent in Vedbæk, Greater Copenhagen
- 7,292 DKK per month
- 795 DKK /m2/year
-
148 m2 office space for rent in Hillerød, North Zealand
- 11,717 DKK per month
- 950 DKK /m2/year
-
98 m2 office space for rent in Kongens Lyngby, Greater Copenhagen
- 14,292 DKK per month
- 1,750 DKK /m2/year
-
110 m2 office space for rent in Værløse, North Zealand
- 10,000 DKK per month
- 1,090 DKK /m2/year
-
130 m2 office space for rent in Værløse, North Zealand
- 5,687 DKK per month
- 524 DKK /m2/year
-
231 m2 office space for rent in Kongens Lyngby, Greater Copenhagen
- 32,250 DKK per month
- 1,675 DKK /m2/year
-
477 m2 office space for rent in Allerød, North Zealand
- 20,000 DKK per month
- 503 DKK /m2/year
-
230 m2 office space for rent in Allerød, North Zealand
- 15,000 DKK per month
- 782 DKK /m2/year
-
752 m2 warehouse for rent in Helsingør, North Zealand
- 34,300 DKK per month
- 547 DKK /m2/year
-
119 m2 office space for rent in Værløse, North Zealand
- 8,500 DKK per month
- 857 DKK /m2/year
-
310 m2 office space for rent in Allerød, North Zealand
- 16,791 DKK per month
- 649 DKK /m2/year
-
301 m2 office space for rent in Birkerød, North Zealand
- 27,083 DKK per month
- 1,079 DKK /m2/year
Frequently asked questions
Statistics on the development of available commercial real estate for rent in North Zealand over the past month
Below you can see the development of available commercial real estate for rent in North Zealand over the past month. In the first column you see the date. In the second column you see the total amount of commercial real estate for rent in North Zealand on the date. In the third column you see the amount of new commercial real estate in North Zealand that was available for rent on the date. In the fourth column you see the amount of commercial real estate in North Zealand that was rented on the date. Also see aggregate statistics on all available commercial rentals in North Zealand over time, aggregate statistics on new commercial rentals in North Zealand over time, aggregate statistics on rented commercial real estate in North Zealand over time
| Date | All commercial real estate for rent | New commercial real estate for rent | Rented out commercial real estate |
|---|---|---|---|
| 6. May 2025 | 1359 | 29 | 32 |
| 5. May 2025 | 1362 | 12 | 32 |
| 4. May 2025 | 1382 | 16 | 9 |
| 3. May 2025 | 1375 | 24 | 17 |
| 2. May 2025 | 1368 | 9 | 9 |
| 1. May 2025 | 1368 | 17 | 14 |
| 30. April 2025 | 1365 | 16 | 7 |
| 29. April 2025 | 1356 | 138 | 179 |
| 28. April 2025 | 1397 | 156 | 2 |
| 27. April 2025 | 1243 | 9 | 10 |
| 26. April 2025 | 1244 | 134 | 17 |
| 25. April 2025 | 1127 | 63 | 10 |
| 24. April 2025 | 1074 | 52 | 9 |
| 23. April 2025 | 1031 | 13 | 4 |
| 22. April 2025 | 1022 | 10 | 14 |
| 21. April 2025 | 1026 | 8 | 8 |
| 20. April 2025 | 1026 | 12 | 1 |
| 19. April 2025 | 1015 | 12 | 13 |
| 18. April 2025 | 1016 | 4 | 3 |
| 17. April 2025 | 1015 | 5 | 14 |
| 16. April 2025 | 1024 | 17 | 12 |
| 15. April 2025 | 1019 | 14 | 5 |
| 14. April 2025 | 1010 | 3 | 16 |
| 13. April 2025 | 1023 | 7 | 47 |
| 12. April 2025 | 1063 | 16 | 33 |
| 11. April 2025 | 1080 | 13 | 7 |
| 10. April 2025 | 1074 | 8 | 10 |
| 9. April 2025 | 1076 | 4 | 10 |
| 8. April 2025 | 1082 | 13 | 5 |
| 7. April 2025 | 1074 | 6 | 7 |
| 6. April 2025 | 1075 | 1 | 0 |
Statistics on currently available commercial spaces for rent in North Zealand in Denmark
In the table below, you see a series of data about available commercial space to rent in North Zealand.Also see gathered statistics of all available commercial space in North Zealand over time, the gathered statistics of new commercial space in North Zealand over time, the gathered statistics of rented commercial space in North Zealand over time
| Total | |
|---|---|
| Available premises | 1,089 |
| New premises since yesterday | 29 |
| Rented out premises since yesterday | 32 |
| Total available m2 | 517,932 |
| Average price per m2 per year without expenses | 50,003 |
| Highest price per m2 per year | 39,373,226.24 |
| Lowest price per m2 per year | 17 |


