Commercial space in Denmark
See all available business premises, commercial properties and commercial spaces in Denmark below. If you are looking for commercial real estate, business space, a business premise or commercial space in Denmark, you have come to the right place. We have almost all available commercial spaces in Denmark in our database. Find your business premise in Denmark here. Enjoy.
13,568 company spaces found
-
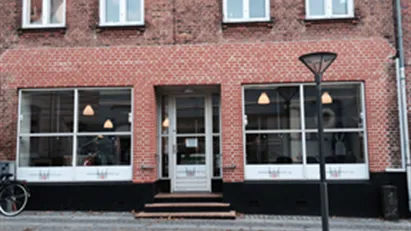
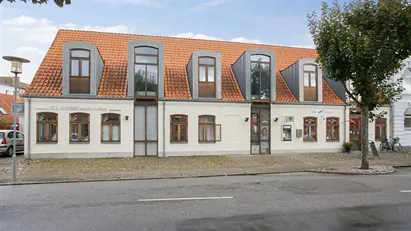
105 m2 shop for rent in Nyborg, Funen
- 9,713 DKK per month
- 1,110 DKK /m2/year
-
70 m2 shop for rent in Randers C, Randers
- 5,000 DKK per month
- 857 DKK /m2/year
-
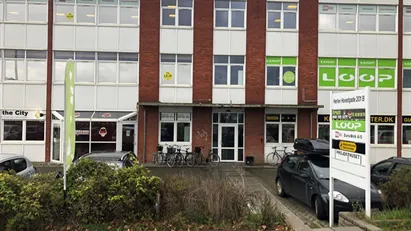
751 m2 office space for rent in Herlev, Greater Copenhagen
- 46,938 DKK per month
- 750 DKK /m2/year
-
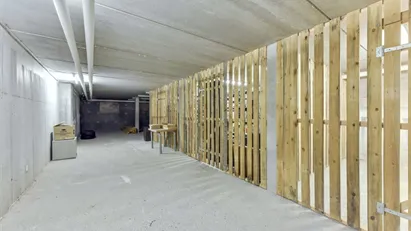
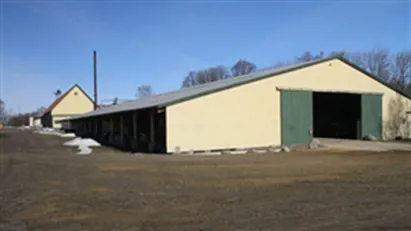
400 m2 warehouse for rent in Vojens, Region of Southern Denmark
- 4,000 DKK per month
- 120 DKK /m2/year
-
250 m2 office space for rent in Løgumkloster, Region of Southern Denmark
- 12,500 DKK per month
- 600 DKK /m2/year
-
580 m2 warehouse for rent in Vojens, Region of Southern Denmark
- 5,800 DKK per month
- 120 DKK /m2/year
-
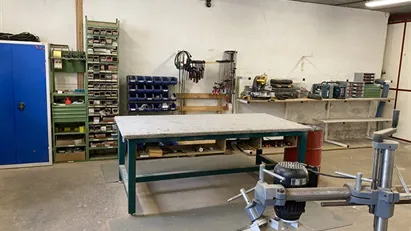
80 m2 industrial property for rent in Brenderup Fyn, Funen
- 8,000 DKK per month
- 1,200 DKK /m2/year
-
20 m2 warehouse for rent in Hjørring, North Jutland Region
- 1,100 DKK per month
- 660 DKK /m2/year
-
253 m2 office space for rent in Odense C, Odense
- 31,625 DKK per month
- 1,500 DKK /m2/year
-
600 m2 shop for rent in Odense C, Odense
- 92,583 DKK per month
- 1,851 DKK /m2/year
-
11 m2 clinic for rent in Hillerød, North Zealand
- 5,500 DKK per month
- 6,000 DKK /m2/year
-
300 m2 office space for rent in Hornslet, Central Jutland Region
- 21,250 DKK per month
- 850 DKK /m2/year
-
520 m2 shop for rent in Rønne, Bornholm
- 17,333 DKK per month
- 400 DKK /m2/year
Frequently asked questions
Statistics on the development of available commercial real estate for rent in Denmark over the past month
Also see aggregate statistics on all available commercial rentals in Denmark over time, aggregate statistics on new commercial rentals in Denmark over time, aggregate statistics on rented commercial real estate in Denmark over time
| Date | |||
|---|---|---|---|
| 21. January 2025 | 16892 | 157 | 496 |
| 20. January 2025 | 17231 | 394 | 88 |
| 19. January 2025 | 16925 | 258 | 562 |
| 18. January 2025 | 17229 | 107 | 214 |
| 17. January 2025 | 17336 | 356 | 11 |
| 16. January 2025 | 16991 | 144 | 290 |
| 15. January 2025 | 17137 | 116 | 612 |
| 14. January 2025 | 17633 | 120 | 45 |
| 13. January 2025 | 17558 | 121 | 50 |
| 12. January 2025 | 17487 | 269 | 524 |
| 11. January 2025 | 17742 | 253 | 601 |
| 10. January 2025 | 18090 | 245 | 372 |
| 9. January 2025 | 18217 | 371 | 7 |
| 8. January 2025 | 17853 | 234 | 518 |
| 7. January 2025 | 18137 | 107 | 16 |
| 6. January 2025 | 18046 | 80 | 543 |
| 5. January 2025 | 18509 | 303 | 3 |
| 4. January 2025 | 18209 | 48 | 83 |
| 3. January 2025 | 18244 | 62 | 320 |
| 2. January 2025 | 18502 | 432 | 2 |
| 1. January 2025 | 18072 | 205 | 816 |
| 31. December 2024 | 18683 | 400 | 10 |
| 30. December 2024 | 18293 | 185 | 183 |
| 29. December 2024 | 18291 | 23 | 274 |
| 28. December 2024 | 18542 | 19 | 72 |
| 27. December 2024 | 18595 | 531 | 0 |
| 26. December 2024 | 18064 | 117 | 630 |
| 25. December 2024 | 18577 | 394 | 7 |
| 24. December 2024 | 18190 | 492 | 40 |
| 23. December 2024 | 17738 | 92 | 848 |
| 22. December 2024 | 18494 | 29 | 0 |
Statistics on currently available commercial spaces in Denmark
Also see gathered statistics of all available commercial space over time, the gathered statistics of new commercial space over time, the gathered statistics of rented commercial space over time
| Total | |
|---|---|
| Available premises | 13,568 |
| New premises since yesterday | 157 |
| Rented out premises since yesterday | 496 |
| Total available m2 | 11,873,130 |
| Average price per m2 per year without expenses | 55,701 |
| Highest price per m2 per year | 286,862,030.13 |
| Lowest price per m2 per year | 1 |


