Available commercial properties in The Netherlands
See all available commercial properties in The Netherlands below. If you are looking for commercial property in The Netherlands, you have come to the right place. We have almost all available commercial properties in The Netherlands in our database. Find commercial property in The Netherlands here. Enjoy.
6,907 commercial properties found
-
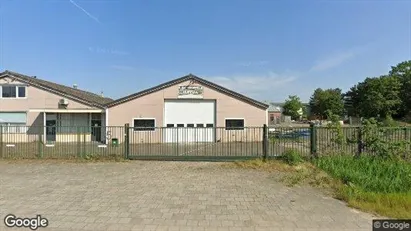
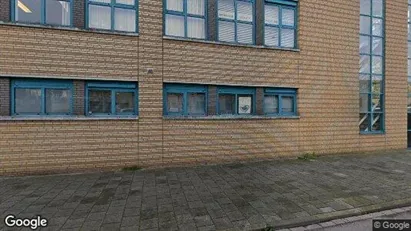
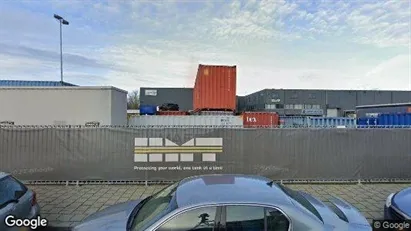
910 m2 commercial space for rent in Cranendonck, North Brabant
- 8,292 EUR per month
- 109.34 EUR /m2/year
-
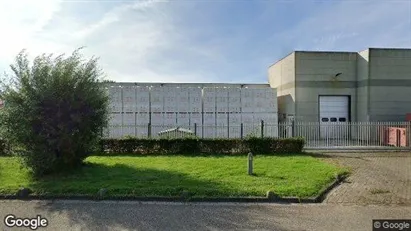
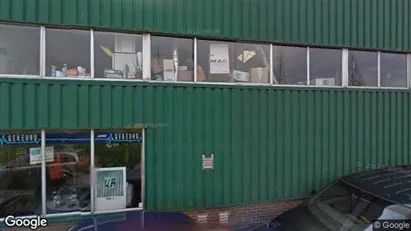
1275 m2 commercial space for rent in Eersel, North Brabant
- 8,500 EUR per month
- 80 EUR /m2/year
-
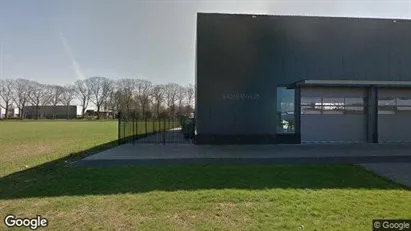
2670 m2 commercial space for rent in IJsselstein, Province of Utrecht
- 18,333 EUR per month
- 82.40 EUR /m2/year
-
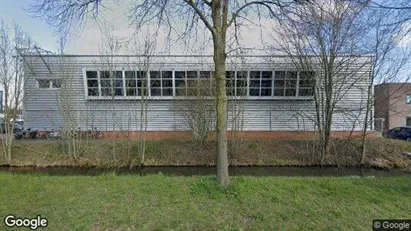
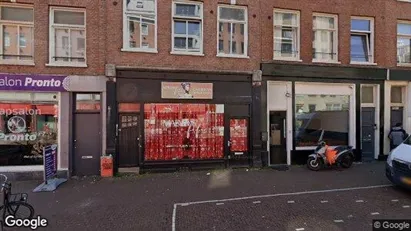
12 m2 commercial space for rent in Amsterdam Oud-West, Amsterdam
- 3,150 EUR per month
- 3,150 EUR /m2/year
-
224 m2 commercial space for rent in Eindhoven, North Brabant
- 2,500 EUR per month
- 133.93 EUR /m2/year
-
146 m2 commercial space for rent in Barendrecht, South Holland
- 1,675 EUR per month
- 137.67 EUR /m2/year
-
613 m2 commercial space for rent in Zwijndrecht, South Holland
- 4,350 EUR per month
- 85.15 EUR /m2/year
-
2670 m2 commercial space for rent in Waalwijk, North Brabant
- 14,583 EUR per month
- 65.54 EUR /m2/year
-
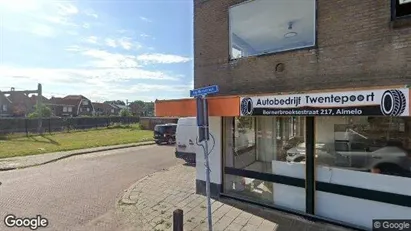
692 m2 commercial space for rent in Almelo, Overijssel
- 2,417 EUR per month
- 41.91 EUR /m2/year
-
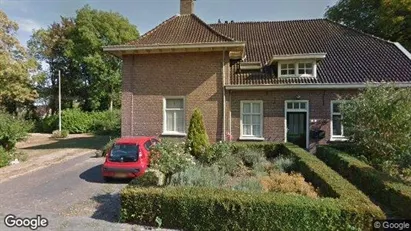
592 m2 commercial space for rent in Woerden, Province of Utrecht
- 8,364 EUR per month
- 169.54 EUR /m2/year
-
400 m2 commercial space for rent in Weesp, North Holland
- 3,950 EUR per month
- 118.50 EUR /m2/year
-
55 m2 commercial space for rent in Leek, Groningen (region)
- 650 EUR per month
- 141.82 EUR /m2/year
Frequently asked questions
Statistics on the development of available commercial properties for rent in The Netherlands over the past month
Also see aggregate statistics on all available commercial properties in The Netherlands over time, aggregate statistics on new commercial properties in The Netherlands over time, aggregate statistics on rented commercial properties in The Netherlands over time
| Date | |||
|---|---|---|---|
| 18. February 2025 | 6262 | 31 | 0 |
| 17. February 2025 | 6231 | 165 | 160 |
| 16. February 2025 | 6226 | 118 | 38 |
| 15. February 2025 | 6146 | 22 | 122 |
| 14. February 2025 | 6246 | 182 | 89 |
| 13. February 2025 | 6153 | 143 | 134 |
| 12. February 2025 | 6144 | 106 | 132 |
| 11. February 2025 | 6170 | 38 | 21 |
| 10. February 2025 | 6153 | 48 | 55 |
| 9. February 2025 | 6160 | 169 | 177 |
| 8. February 2025 | 6168 | 68 | 0 |
| 7. February 2025 | 6100 | 167 | 196 |
| 6. February 2025 | 6129 | 115 | 124 |
| 5. February 2025 | 6138 | 176 | 99 |
| 4. February 2025 | 6061 | 51 | 92 |
| 3. February 2025 | 6102 | 76 | 91 |
| 2. February 2025 | 6117 | 138 | 124 |
| 1. February 2025 | 6103 | 41 | 13 |
| 31. January 2025 | 6075 | 73 | 70 |
| 30. January 2025 | 6072 | 133 | 147 |
| 29. January 2025 | 6086 | 109 | 80 |
| 28. January 2025 | 6057 | 23 | 18 |
| 27. January 2025 | 6052 | 85 | 84 |
| 26. January 2025 | 6051 | 135 | 94 |
| 25. January 2025 | 6010 | 85 | 104 |
| 24. January 2025 | 6029 | 163 | 135 |
| 23. January 2025 | 6001 | 125 | 158 |
| 22. January 2025 | 6034 | 29 | 73 |
| 21. January 2025 | 6078 | 75 | 55 |
| 20. January 2025 | 6058 | 42 | 53 |
| 19. January 2025 | 6069 | 165 | 0 |
Statistics on currently available commercial properties in The Netherlands
Also see gathered statistics of all available commercial properties over time, the gathered statistics of new commercial properties over time, the gathered statistics of rented commercial properties over time
| Commercial properties | |
|---|---|
| Available premises | 6,267 |
| New premises since yesterday | 31 |
| Rented out premises since yesterday | 0 |
| Total available m2 | 9,583,037 |
| Average price per m2 per year without expenses | 527 |
| Highest price per m2 per year | 85,000 |
| Lowest price per m2 per year | 1 |


