Available office spaces in North Brabant
See all available office spaces in North Brabant below. If you are looking for office space in North Brabant, you have come to the right place. We have almost all available office spaces in North Brabant in our database. Find office space in North Brabant here. Enjoy.
1,115 office spaces found
-
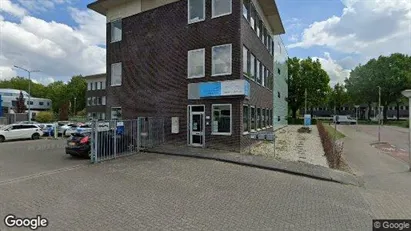
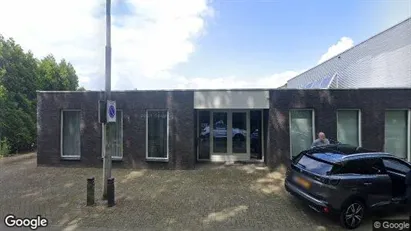
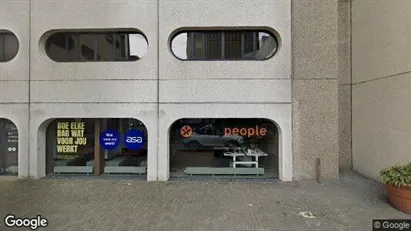
130 m2 office space for rent in Den Bosch, North Brabant
- 1,400 EUR per month
- 129.23 EUR /m2/year
-
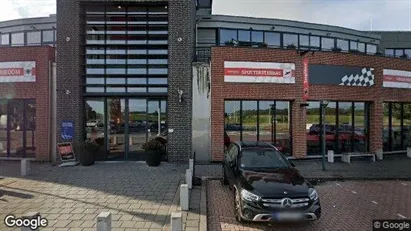
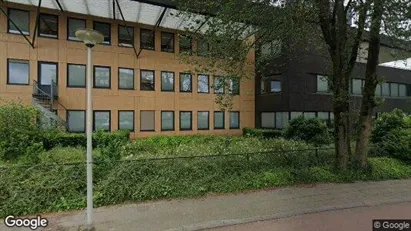
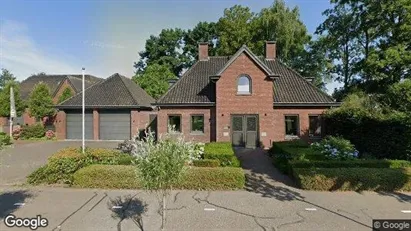
500 m2 office space for rent in Helmond, North Brabant
- 590 EUR per month
- 14.16 EUR /m2/year
-
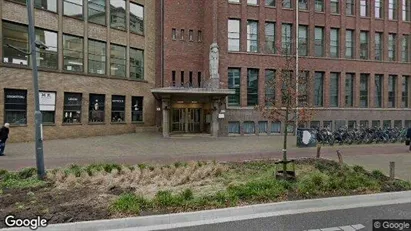
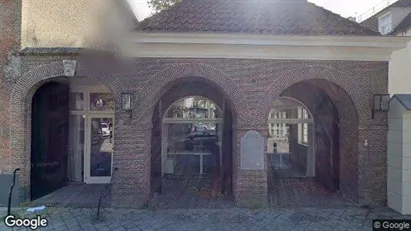
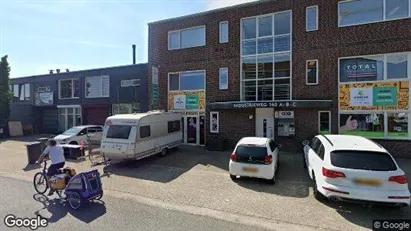
59 m2 office space for rent in Bergen op Zoom, North Brabant
- 8,364 EUR per month
- 1,701.15 EUR /m2/year
-
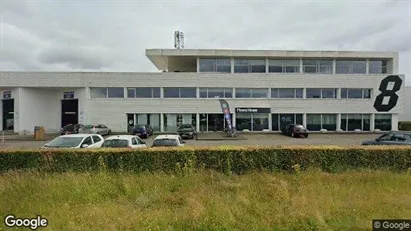
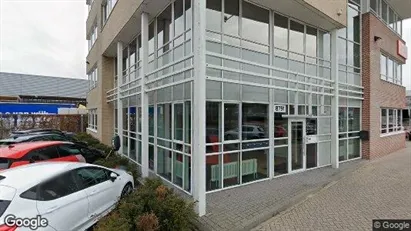
48 m2 office space for rent in Veldhoven, North Brabant
- 775 EUR per month
- 193.75 EUR /m2/year
-
80 m2 office space for rent in Tilburg, North Brabant
- 833 EUR per month
- 125 EUR /m2/year
-
212 m2 office space for rent in Tilburg, North Brabant
- 498 EUR per month
- 28.16 EUR /m2/year
-
39 m2 office space for rent in Roosendaal, North Brabant
- 300 EUR per month
- 92.31 EUR /m2/year
-
287 m2 office space for rent in Oosterhout, North Brabant
- 5,417 EUR per month
- 226.48 EUR /m2/year
-
240 m2 office space for rent in Geldrop-Mierlo, North Brabant
- 1,350 EUR per month
- 67.50 EUR /m2/year
-
112 m2 office space for rent in Den Bosch, North Brabant
- 550 EUR per month
- 58.93 EUR /m2/year
-
200 m2 office space for rent in Best, North Brabant
- 1,600 EUR per month
- 96 EUR /m2/year
Frequently asked questions
Statistics on the development of available office spaces for rent in North Brabant over the past month
Also see aggregate statistics on all available office spaces in North Brabant over time, aggregate statistics on new office spaces in North Brabant over time, aggregate statistics on rented office spaces in North Brabant over time
| Date | |||
|---|---|---|---|
| 1. February 2025 | 1100 | 32 | 29 |
| 31. January 2025 | 1097 | 25 | 29 |
| 30. January 2025 | 1101 | 27 | 41 |
| 29. January 2025 | 1115 | 26 | 30 |
| 28. January 2025 | 1119 | 37 | 32 |
| 27. January 2025 | 1114 | 41 | 52 |
| 26. January 2025 | 1125 | 19 | 16 |
| 25. January 2025 | 1122 | 43 | 57 |
| 24. January 2025 | 1136 | 6 | 14 |
| 23. January 2025 | 1144 | 30 | 54 |
| 22. January 2025 | 1168 | 46 | 10 |
| 21. January 2025 | 1132 | 18 | 24 |
| 20. January 2025 | 1138 | 27 | 19 |
| 19. January 2025 | 1130 | 55 | 94 |
| 18. January 2025 | 1169 | 29 | 0 |
| 17. January 2025 | 1140 | 22 | 64 |
| 16. January 2025 | 1182 | 58 | 0 |
| 15. January 2025 | 1124 | 29 | 46 |
| 14. January 2025 | 1141 | 21 | 40 |
| 13. January 2025 | 1160 | 28 | 7 |
| 12. January 2025 | 1139 | 31 | 53 |
| 11. January 2025 | 1161 | 17 | 16 |
| 10. January 2025 | 1160 | 42 | 0 |
| 9. January 2025 | 1118 | 33 | 60 |
| 8. January 2025 | 1145 | 29 | 22 |
| 7. January 2025 | 1138 | 5 | 11 |
| 6. January 2025 | 1144 | 17 | 44 |
| 5. January 2025 | 1171 | 32 | 11 |
| 4. January 2025 | 1150 | 28 | 32 |
| 3. January 2025 | 1154 | 5 | 41 |
| 2. January 2025 | 1190 | 0 | 0 |
Statistics on currently available office spaces in North Brabant in The Netherlands
Also see gathered statistics of all available office spaces in North Brabant over time, the gathered statistics of new office spaces in North Brabant over time, the gathered statistics of rented office spaces in North Brabant over time
| Office spaces | |
|---|---|
| Available premises | 1,115 |
| New premises since yesterday | 32 |
| Rented out premises since yesterday | 29 |
| Total available m2 | 1,506,640 |
| Average price per m2 per year without expenses | 258 |
| Highest price per m2 per year | 34,210.53 |
| Lowest price per m2 per year | 1.01 |


