Clinic for rent in Oosterhout
See all clinics for rent in Oosterhout below. If you are looking for a clinic for rent, clinic space for rent, clinic lease or clinic location for rent in Oosterhout, you have come to the right place. We have almost all available clinics for rent, clinics spaces for rent, clinic locations for rent and clinic rentals in Oosterhout in our database. Find your clinic rental here. Enjoy.
-
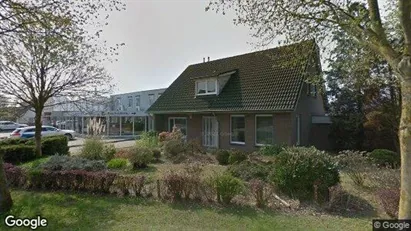
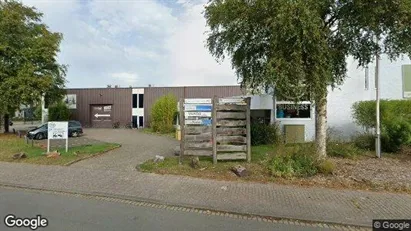
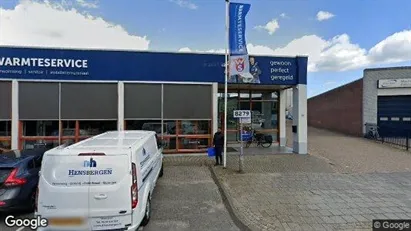
403 m2 commercial space for rent in Heusden, North Brabant
- 2,000 EUR per month
- 59.55 EUR /m2/year
-
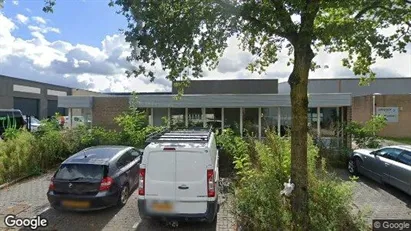
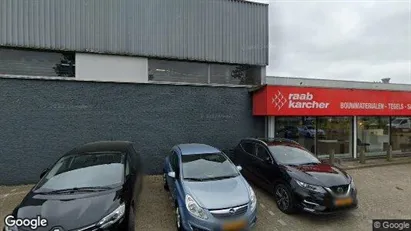
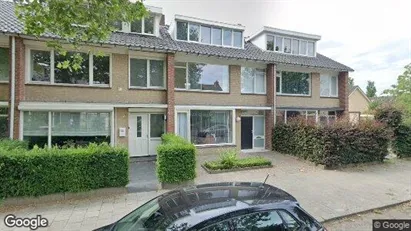
147 m2 office space for rent in Laarbeek, North Brabant
- 1,250 EUR per month
- 102.04 EUR /m2/year
-
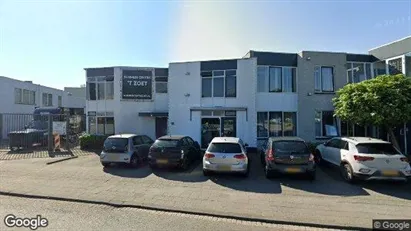
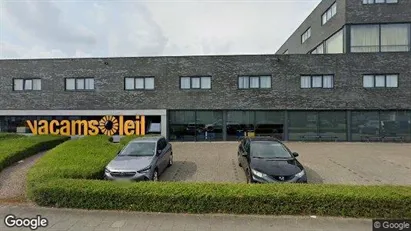
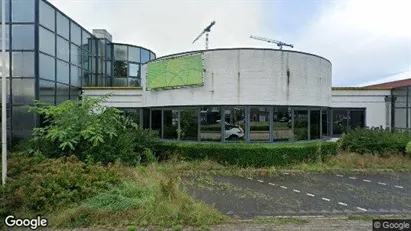
172 m2 commercial space for rent in Oss, North Brabant
- 1,700 EUR per month
- 118.60 EUR /m2/year
-
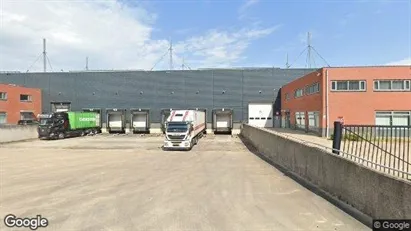
44 m2 office space for rent in Best, North Brabant
- 650 EUR per month
- 177.27 EUR /m2/year
-
28 m2 office space for rent in Breda, North Brabant
- 750 EUR per month
- 321.43 EUR /m2/year
-
2400 m2 office space for rent in Breda, North Brabant
- 400 EUR per month
- 2 EUR /m2/year
-
3352 m2 office space for rent in Eindhoven, North Brabant
- 31,250 EUR per month
- 111.87 EUR /m2/year
-
6180 m2 industrial property for rent in Den Bosch, North Brabant
- 39,792 EUR per month
- 77.27 EUR /m2/year
-
98 m2 office space for rent in Eindhoven, North Brabant
- 1,450 EUR per month
- 177.55 EUR /m2/year
-
1975 m2 industrial property for rent in Eindhoven, North Brabant
- 7,406 EUR per month
- 45 EUR /m2/year
-
220 m2 commercial space for rent in Tilburg, North Brabant
- 1,395 EUR per month
- 76.09 EUR /m2/year
-
115 m2 office space for rent in Oosterhout, North Brabant
- 1,300 EUR per month
- 135.65 EUR /m2/year
-
1090 m2 industrial property for rent in Bladel, North Brabant
- 4,750 EUR per month
- 52.29 EUR /m2/year
-
94 m2 office space for rent in Eindhoven, North Brabant
- 420 EUR per month
- 53.62 EUR /m2/year
Frequently asked questions
Statistics on the development of available clinics for rent in Oosterhout over the past month
Below you can see the development of available clinics for rent in Oosterhout over the past month. In the first column you see the date. In the second column you see the total amount of clinics for rent in Oosterhout on the date. In the third column you see the amount of new clinics in Oosterhout that was available for rent on the date. In the fourth column you see the amount of clinics in Oosterhout that was rented on the date. Also see aggregate statistics on all available clinics in Oosterhout over time, aggregate statistics on new clinics in Oosterhout over time, aggregate statistics on rented clinics in Oosterhout over time
| Date | All clinics for rent | New clinics for rent | Rented out clinics |
|---|---|---|---|
| 25. February 2025 | 0 | 0 | 0 |
| 24. February 2025 | 0 | 0 | 0 |
| 23. February 2025 | 0 | 0 | 0 |
| 22. February 2025 | 0 | 0 | 0 |
| 21. February 2025 | 0 | 0 | 0 |
| 20. February 2025 | 0 | 0 | 0 |
| 19. February 2025 | 0 | 0 | 0 |
| 18. February 2025 | 0 | 0 | 0 |
| 17. February 2025 | 0 | 0 | 0 |
| 16. February 2025 | 0 | 0 | 0 |
| 15. February 2025 | 0 | 0 | 0 |
| 14. February 2025 | 0 | 0 | 0 |
| 13. February 2025 | 0 | 0 | 0 |
| 12. February 2025 | 0 | 0 | 0 |
| 11. February 2025 | 0 | 0 | 0 |
| 10. February 2025 | 0 | 0 | 0 |
| 9. February 2025 | 0 | 0 | 0 |
| 8. February 2025 | 0 | 0 | 0 |
| 7. February 2025 | 0 | 0 | 0 |
| 6. February 2025 | 0 | 0 | 0 |
| 5. February 2025 | 0 | 0 | 0 |
| 4. February 2025 | 0 | 0 | 0 |
| 3. February 2025 | 0 | 0 | 0 |
| 2. February 2025 | 0 | 0 | 0 |
| 1. February 2025 | 0 | 0 | 0 |
| 31. January 2025 | 0 | 0 | 0 |
| 30. January 2025 | 0 | 0 | 0 |
| 29. January 2025 | 0 | 0 | 0 |
| 28. January 2025 | 0 | 0 | 0 |
| 27. January 2025 | 0 | 0 | 0 |
| 26. January 2025 | 0 | 0 | 0 |
Statistics on currently available clinics for rent in Oosterhout in The Netherlands
In the table below, you see a series of data about available clinics to rent in Oosterhout.Also see gathered statistics of all available clinics in Oosterhout over time, the gathered statistics of new clinics in Oosterhout over time, the gathered statistics of rented clinics in Oosterhout over time
| Clinics | |
|---|---|
| Available premises | 0 |
| New premises since yesterday | 0 |
| Rented out premises since yesterday | 0 |
| Total available m2 | 0 |
| Average price per m2 per year without expenses | 0 |
| Highest price per m2 per year | 0 |
| Lowest price per m2 per year | 0 |


